Decorative art element Decorative art element Decorative art element

Out of
Our Minds

Ideas, arguments, and musings from inside Harding Loevner.
Featured image for Will Europe Boost Military Spending?

Will Europe Boost Military Spending?

Late in the quarter, NATO announced its plan to increase its defense spending from around 2% of its GDP today to 3.5% by 2035. If realized, that would nearly double total spending—from around US$400 billion to US$800 billion, implying a 7% annualized growth rate. As Germany and other NATO countries loosen fiscal constraints and boost defense budgets, Industrials stocks, particularly in aerospace and defense, have rallied.

But structural challenges remain. For most of the past couple of decades, European defense companies generally exhibited poor growth, in part due to stagnant defense budgets, though the recent upturn could improve that outlook. Many of the publicly listed European defense companies also have partial state ownership of their shares, creating a dynamic in which their largest shareholders are also their largest buyers. This often leads to pressure to offer state owners favorable terms for contracts, which has weighed on the profitability of these European defense contractors relative to their US counterparts.

Still, there are a few compelling quality-growth opportunities in the sector. One example is Safran, a French aerospace firm. Safran’s primary source of growth has been the rise of commercial air traffic and the success of its jet engines. Once in operation, these engines generate decades of higher margins after sale service revenue. But the company generates roughly 20% of its revenue from military exposure tied to jet fighter engines, aircraft components, and positioning and navigation systems. If European defense spending does in fact increase at the proposed rate, that should offer Safran further growth opportunities.

Graphic showing increasing revenue growth (CAGR) in many sectors in Morocco between 2013 and 2023.

Morocco Expands Its Vistas

The following is adapted from our third-quarter report for the Frontier Emerging Markets Equity strategy. Click here to read the full report.

You can see Morocco from Europe, nine miles away from southernmost Spain across the Strait of Gibraltar, yet the African nation flies under the radar for many global investors. Nevertheless, Morocco’s US$150 billion economy is one of the most developed in Africa, featuring advanced infrastructure that has improved the quality of life for its 38 million inhabitants, facilitated trade, and encouraged private investment. Now the country is embarking on an ambitious program to boost growth even more over the next decade.

Bar chart showing returns for select global currencies from January 1, 2024 to September 30, 2024 vs. just 3Q 2024, with the Japanese Yen returning the most at over 10% in 3Q 2024.

Japan’s Mid-Quarter Market Turmoil Ends in Recovery for Fast-Growing Small Caps

An unexpected interest-rate increase from the Bank of Japan helped ignite a market firestorm during the third quarter.

The central bank’s decision in late July caused a swift appreciation in the yen, a currency shift that disrupted the widely used strategy known as the yen carry trade, where investors borrowed at low Japanese rates to purchase higher-yielding foreign assets. The rapid unwinding of these positions, combined with weaker US economic data and disappointing earnings from US technology giants, culminated in a 12% drop in Japan’s Nikkei index on August 5, while expected volatility in the US equity market spiked to a level not seen outside of major crises.

A line chart showing MSCI china's cumulative return decreasing from around March 2023 through February 2024, but with an expected uptick beginning in late 2024.

Chinese Stocks Get a Jolt

Chinese stocks in September had their best week since the 2008 financial crisis after officials unveiled a new set of stimulus measures. The MSCI China Index surged 25% in just the last nine trading days of the third quarter, erasing 20 months’ worth of losses. Unlike other stimulus measures over the previous two years, this one was more comprehensive and included two key financial measures: a 50 basis point cut in the reserve requirement ratio for banks and a 20 basis point drop in the seven-day reverse repo rate.

There were additional measures aimed at boosting the real-estate sector, which rebounded by about 50% in late September, as seen in the chart below. The policy announcements included cutting mortgage rates for existing homeowners by as much as 50 basis points and cutting the down payment requirement for second home purchases by 15%.

Line chart showing cumulative excess returns of the MSCI ACWI ex US Momentum Index vs. the MSCI ACWI ex US Index, which, indexed from zero, went from around 3% in January 2024 to a high of around 13% in June of 2024.

Momentum Investing and the Power of FOMO

The following is adapted from our third-quarter report for the International Equity strategy. Click here to read the full report.

Over the last 18 months, disciplined fundamental investors have been challenged by an episode of price momentum concentrated in a few of the largest stocks in the market. Price momentum refers to a phenomenon where securities whose prices have risen are more likely to keep rising in the short run, while those that have fallen are more likely to experience further declines. The concept of momentum has garnered sufficient adherents to secure its place in the pantheon of portfolio analytics and inspire the creation of numerous indices and ETFs designed to exploit it.

We have deliberately resisted incorporating the momentum factor into our investment process for several reasons. First, simple price momentum does not provide a fundamental basis for making investment decisions. Serial correlation of share price changes has, at best, a weak connection to the underlying business you’re investing in, and nothing to do with what it is worth. Second, momentum investing is literally “chasing” stocks that have already gone up or outperformed (or selling those that already went down or underperformed). This approach leads to higher turnover and trading costs. Lastly, although momentum investing has shown net positive returns over very long periods, there is considerable volatility in its return path. Momentum works until it doesn’t, and when it doesn’t, all the gains you made can be reversed more quickly than you can exit the market. This whipsaw effect makes momentum investing much harder to stomach in practice than it appears in theory.

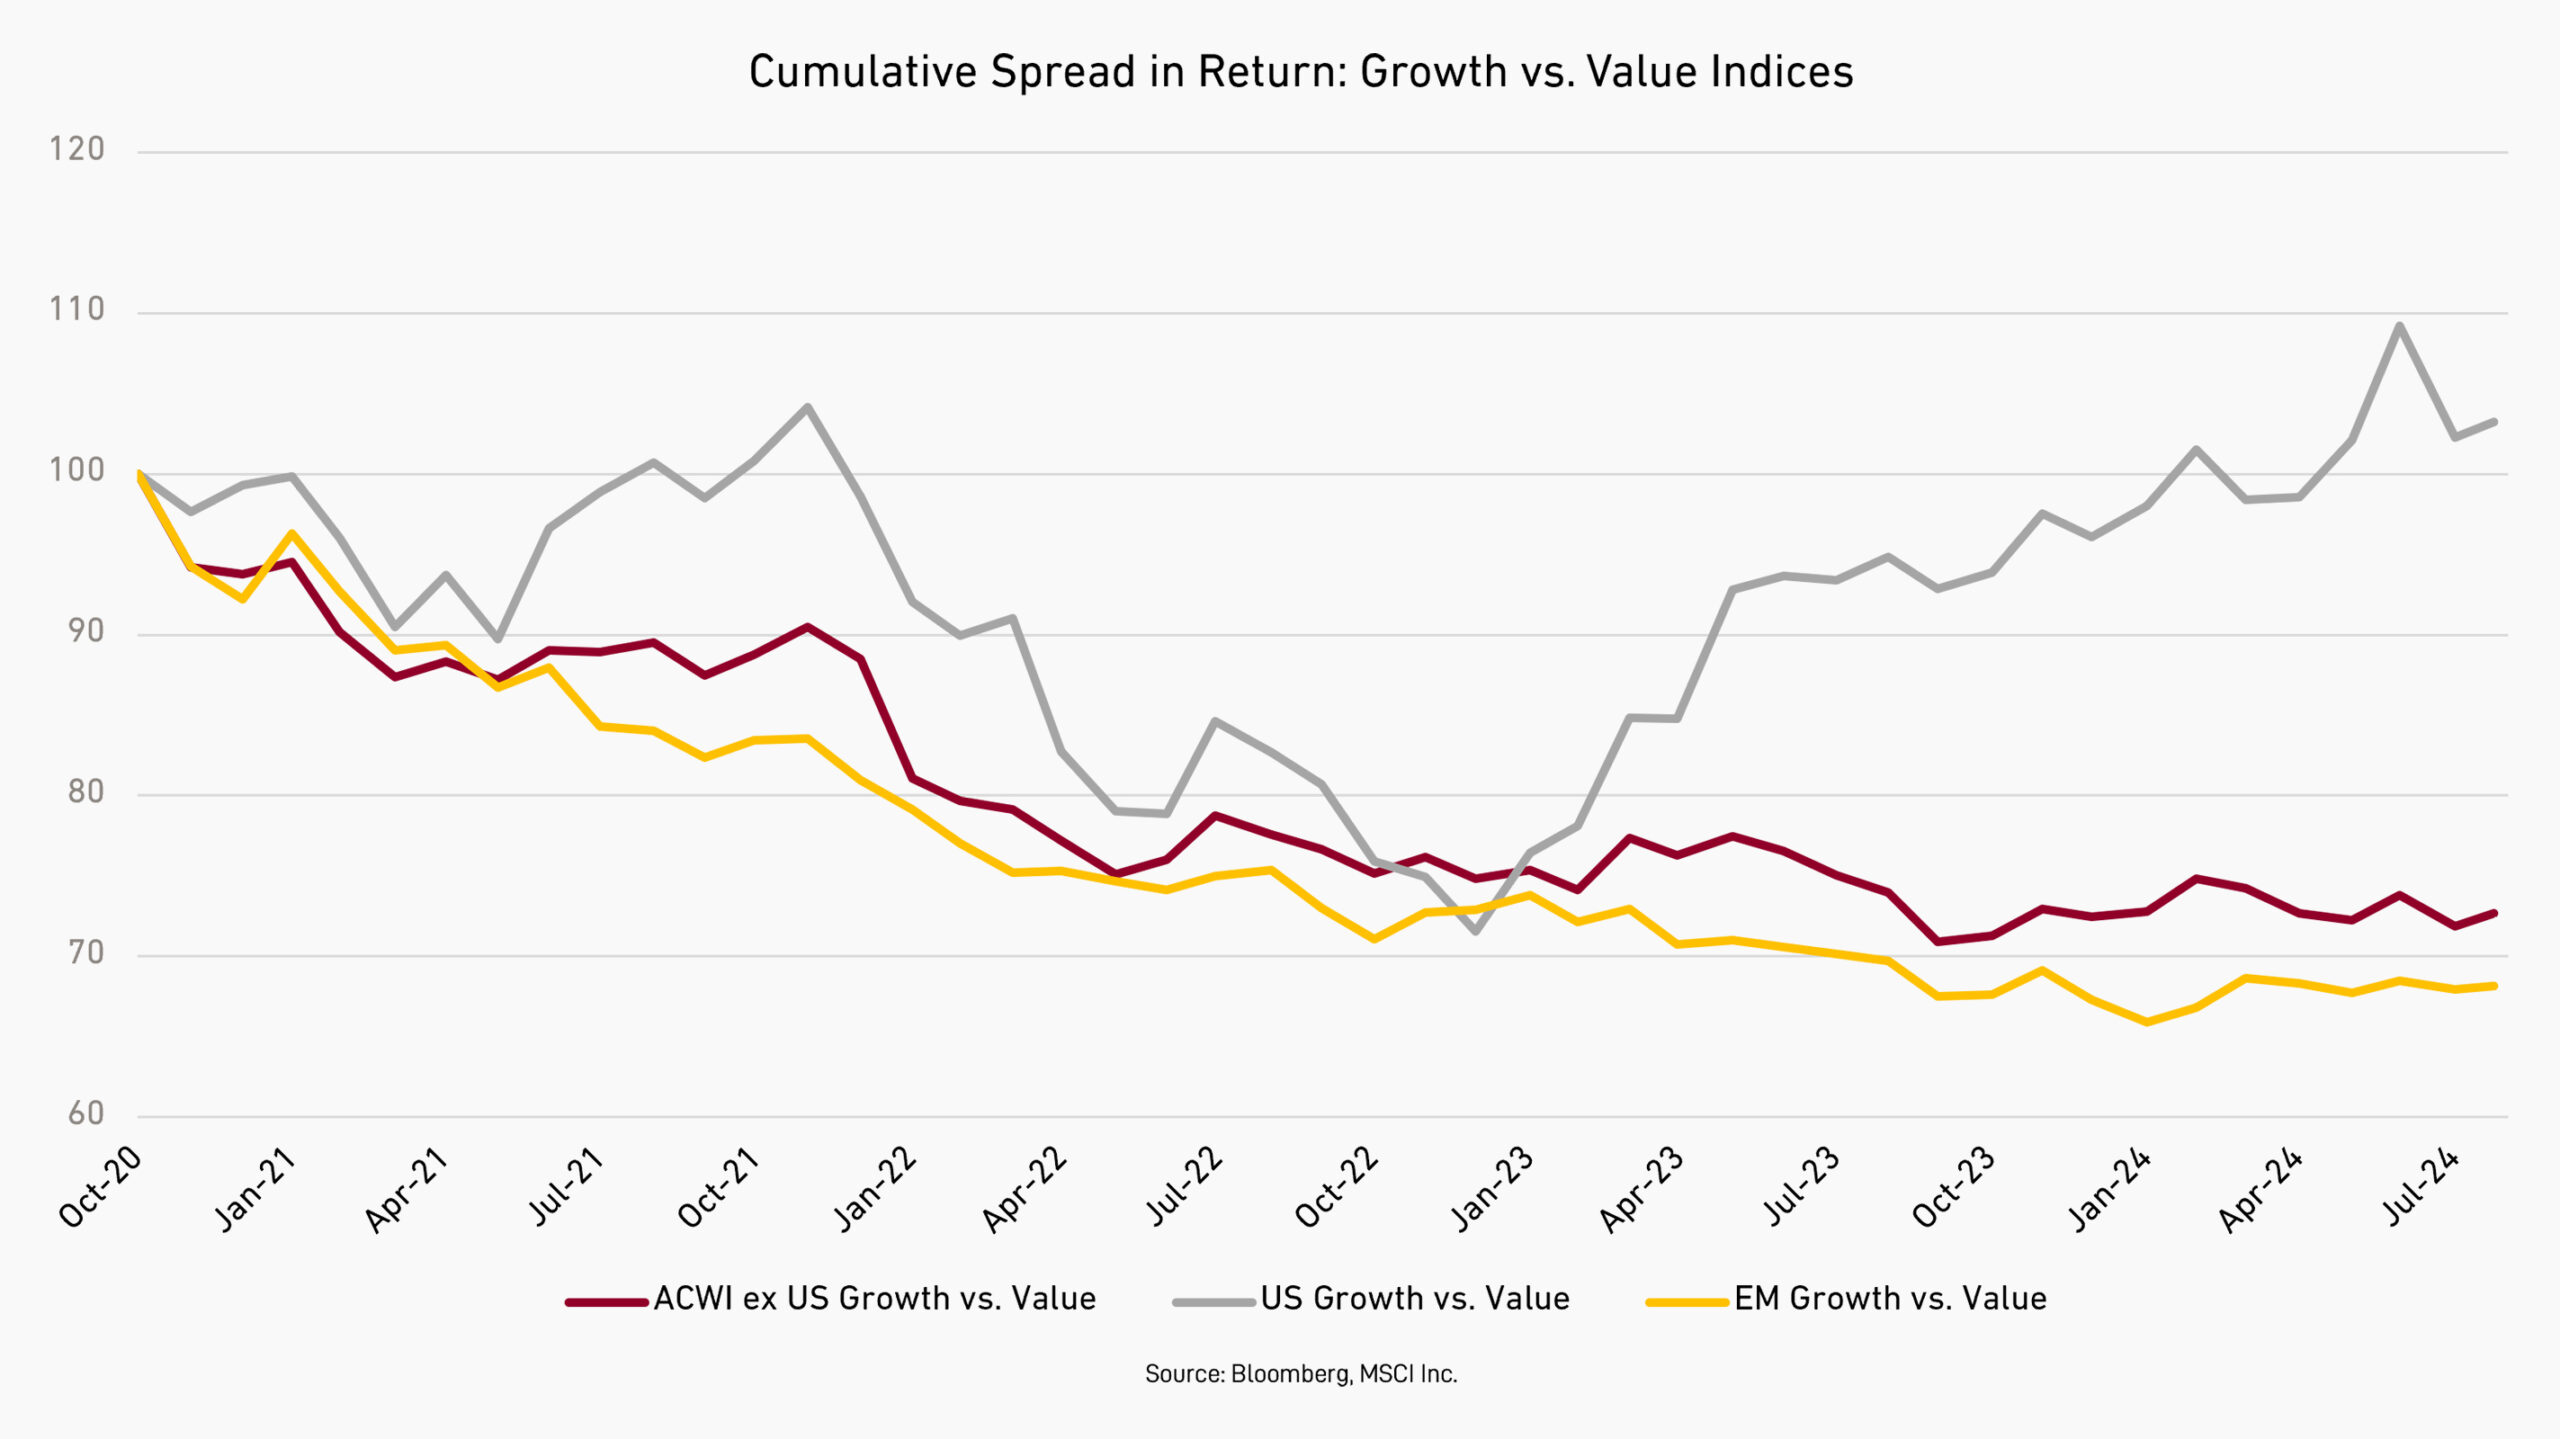
Line chart showing the cumulative spread in returns between growth and value indices in the US, ex US, and Emerging Markets.

Growth Is Beating Value in the US. Will International Follow?

Non-US markets have underperformed the US for quite some time. This has been exacerbated lately by their diverging style factors.

As seen in the chart above, investors largely favored value stocks as the global economy began to reemerge from the COVID-19 pandemic following emergency-use authorization of the first vaccine in late 2020. This headwind for growth stocks has been most significant, and enduring, in international markets. For example, the MSCI All Country World ex US Growth Index lagged its value counterpart by nearly 30 percentage points in the three years through October 2023. But while the value rally has continued outside the US, 2023 saw investors reembrace US growth stocks despite their relatively high valuations.

Line chart depicting the relative valuation of International Small Caps vs. International Large Caps and vs. US Small Caps, where valuations look more attractive for International Small Caps.

Valuations Look Attractive for International Small Caps

International small caps continue to trade near their cheapest valuations relative to international large caps since the 2009 global recession. Although they are also valued at a discount to US small caps, the spread hasn’t changed much over the last two decades.

Even relative to their own historical valuation multiples, international small caps look cheap, with the MSCI All Country World ex US Small Cap Index trading at a price-to-earnings ratio of 14.8, 19% below its 2021 peak. This indicates there is an attractive valuation opportunity for small-cap investors, especially with respect to some high-quality, fast-growing international small companies.

Chart showing the market implied yield of India vs. Global Emerging Markets as of June 30, 2024, with India's median market implied yield of 1.4% an all-time low for the country and an all-time high premium relative to the broader EM index.

Indian Stock Valuations at All-Time High

Investors continue to pour into the Indian stock market. The Nifty 50 Index, up more than 10% year to date, continues to reach new highs. Much of that is due to gains from cheap stocks, including many state-owned enterprises (SOEs) benefiting from government spending. Finding high-quality companies in the Indian market at attractive valuations therefore has become difficult.

One way to understand valuations is the required rate of return, which measures the minimum return for which investors will be willing to allocate capital. An outside view that we refer to is a valuation framework from UBS’ data-analytics platform HOLT that backs out the implied required rate of return investors are demanding from securities in the market, referred to as the market implied yield. At a country level, India’s median market-implied yield of 1.4% is at an all-time low for India and an all-time high premium relative to the broader EM index.

Three heatmaps showing MSCI ACWI ex US Index return spreads by quintiles of growth, quality, and value as of June 30, 2024, highlighting no discernable pattern across markets aside from Japan's value rally.

Japan’s Value Rally Persists

Examining the 1.2% gain of the MSCI All Country World ex US Index in the second quarter, the biggest style effect is evidenced in Japan where there continues to be a strong bias in favor of cheaper stocks, which outperformed the most expensive stocks there by nearly 700 basis points (bps). That brings the advantage for cheaper stocks over more expensive stocks, which tend to be higher-growth and higher-quality companies, to a 1,500bp difference year to date.

As we’ve explored previously, the performance of certain factors can shift markedly in just a few years. Time will tell if this value rally gives way to better performance for more expensive, higher-quality, faster-growing companies in Japan.

Abstract red and orange graphic.

Our 2024 Semi-Annual Letter to Shareholders

It has been our long-standing belief that high-quality businesses will weather difficult or shifting economic environments better than most. This, in part, is due to their operational resilience that allows us to hold on to our investments in their shares during periods of stock market turmoil.

In our semi-annual letter to shareholders, we examine the conundrum of the high-quality return premium, and its possible explanation based in behavioral finance. And we emphasize our dedication to our rigorous investment process in considering companies fueling the recent artificial intelligence boom.

Our long experience may not be a guarantee of skill or prescience. But it does afford us perspective on the ways technological advances affect a wide variety of industries, and the companies operating within them globally. We’re optimistic that our thoughtful and evolving process to analyze those businesses, will, with dedicated effort, yield good long-term investment results.

Investments involve risk and loss is possible.

The Portfolio’s investment objectives, risks, charges and expenses must be read and considered carefully before investing. The statutory and summary prospectuses contain this and other important information about the investment company. They may be obtained by calling toll free (877) 435-8105, or visiting hardingloevnerfunds.com.

The Portfolio is distributed by Quasar Distributors, LLC.

Puzzle illustration with one piece in the middle missing and a simple column chart overlay.

A Quality Problem

For almost half a century, a niche within empirical finance has dedicated itself to sifting through accounting data in search of company traits that influence stock prices. Despite the plethora of factors unearthed, figuring out the precise drivers behind their behavior is still a bit of a mystery. For investors, simply identifying a factor isn’t enough; you also need to understand who’s on the other side of the trade—and why. Otherwise, who’s to say if a historical pattern will repeat in the future.

The difficulty in pinning down exactly what’s behind such canonical factors as quality, value, and momentum shouldn’t be a surprise. Factors can only be observed after the fact, but the underlying mechanisms that produce them are hidden. They are birthed from the complex interplay of buying and selling against a backdrop of economic and geopolitical shifts, all woven together by intricate feedback loops. Because they emerge as properties of a complex system, and because their returns wax and wane over decades, pinpointing a definitive root cause is quite the challenge.

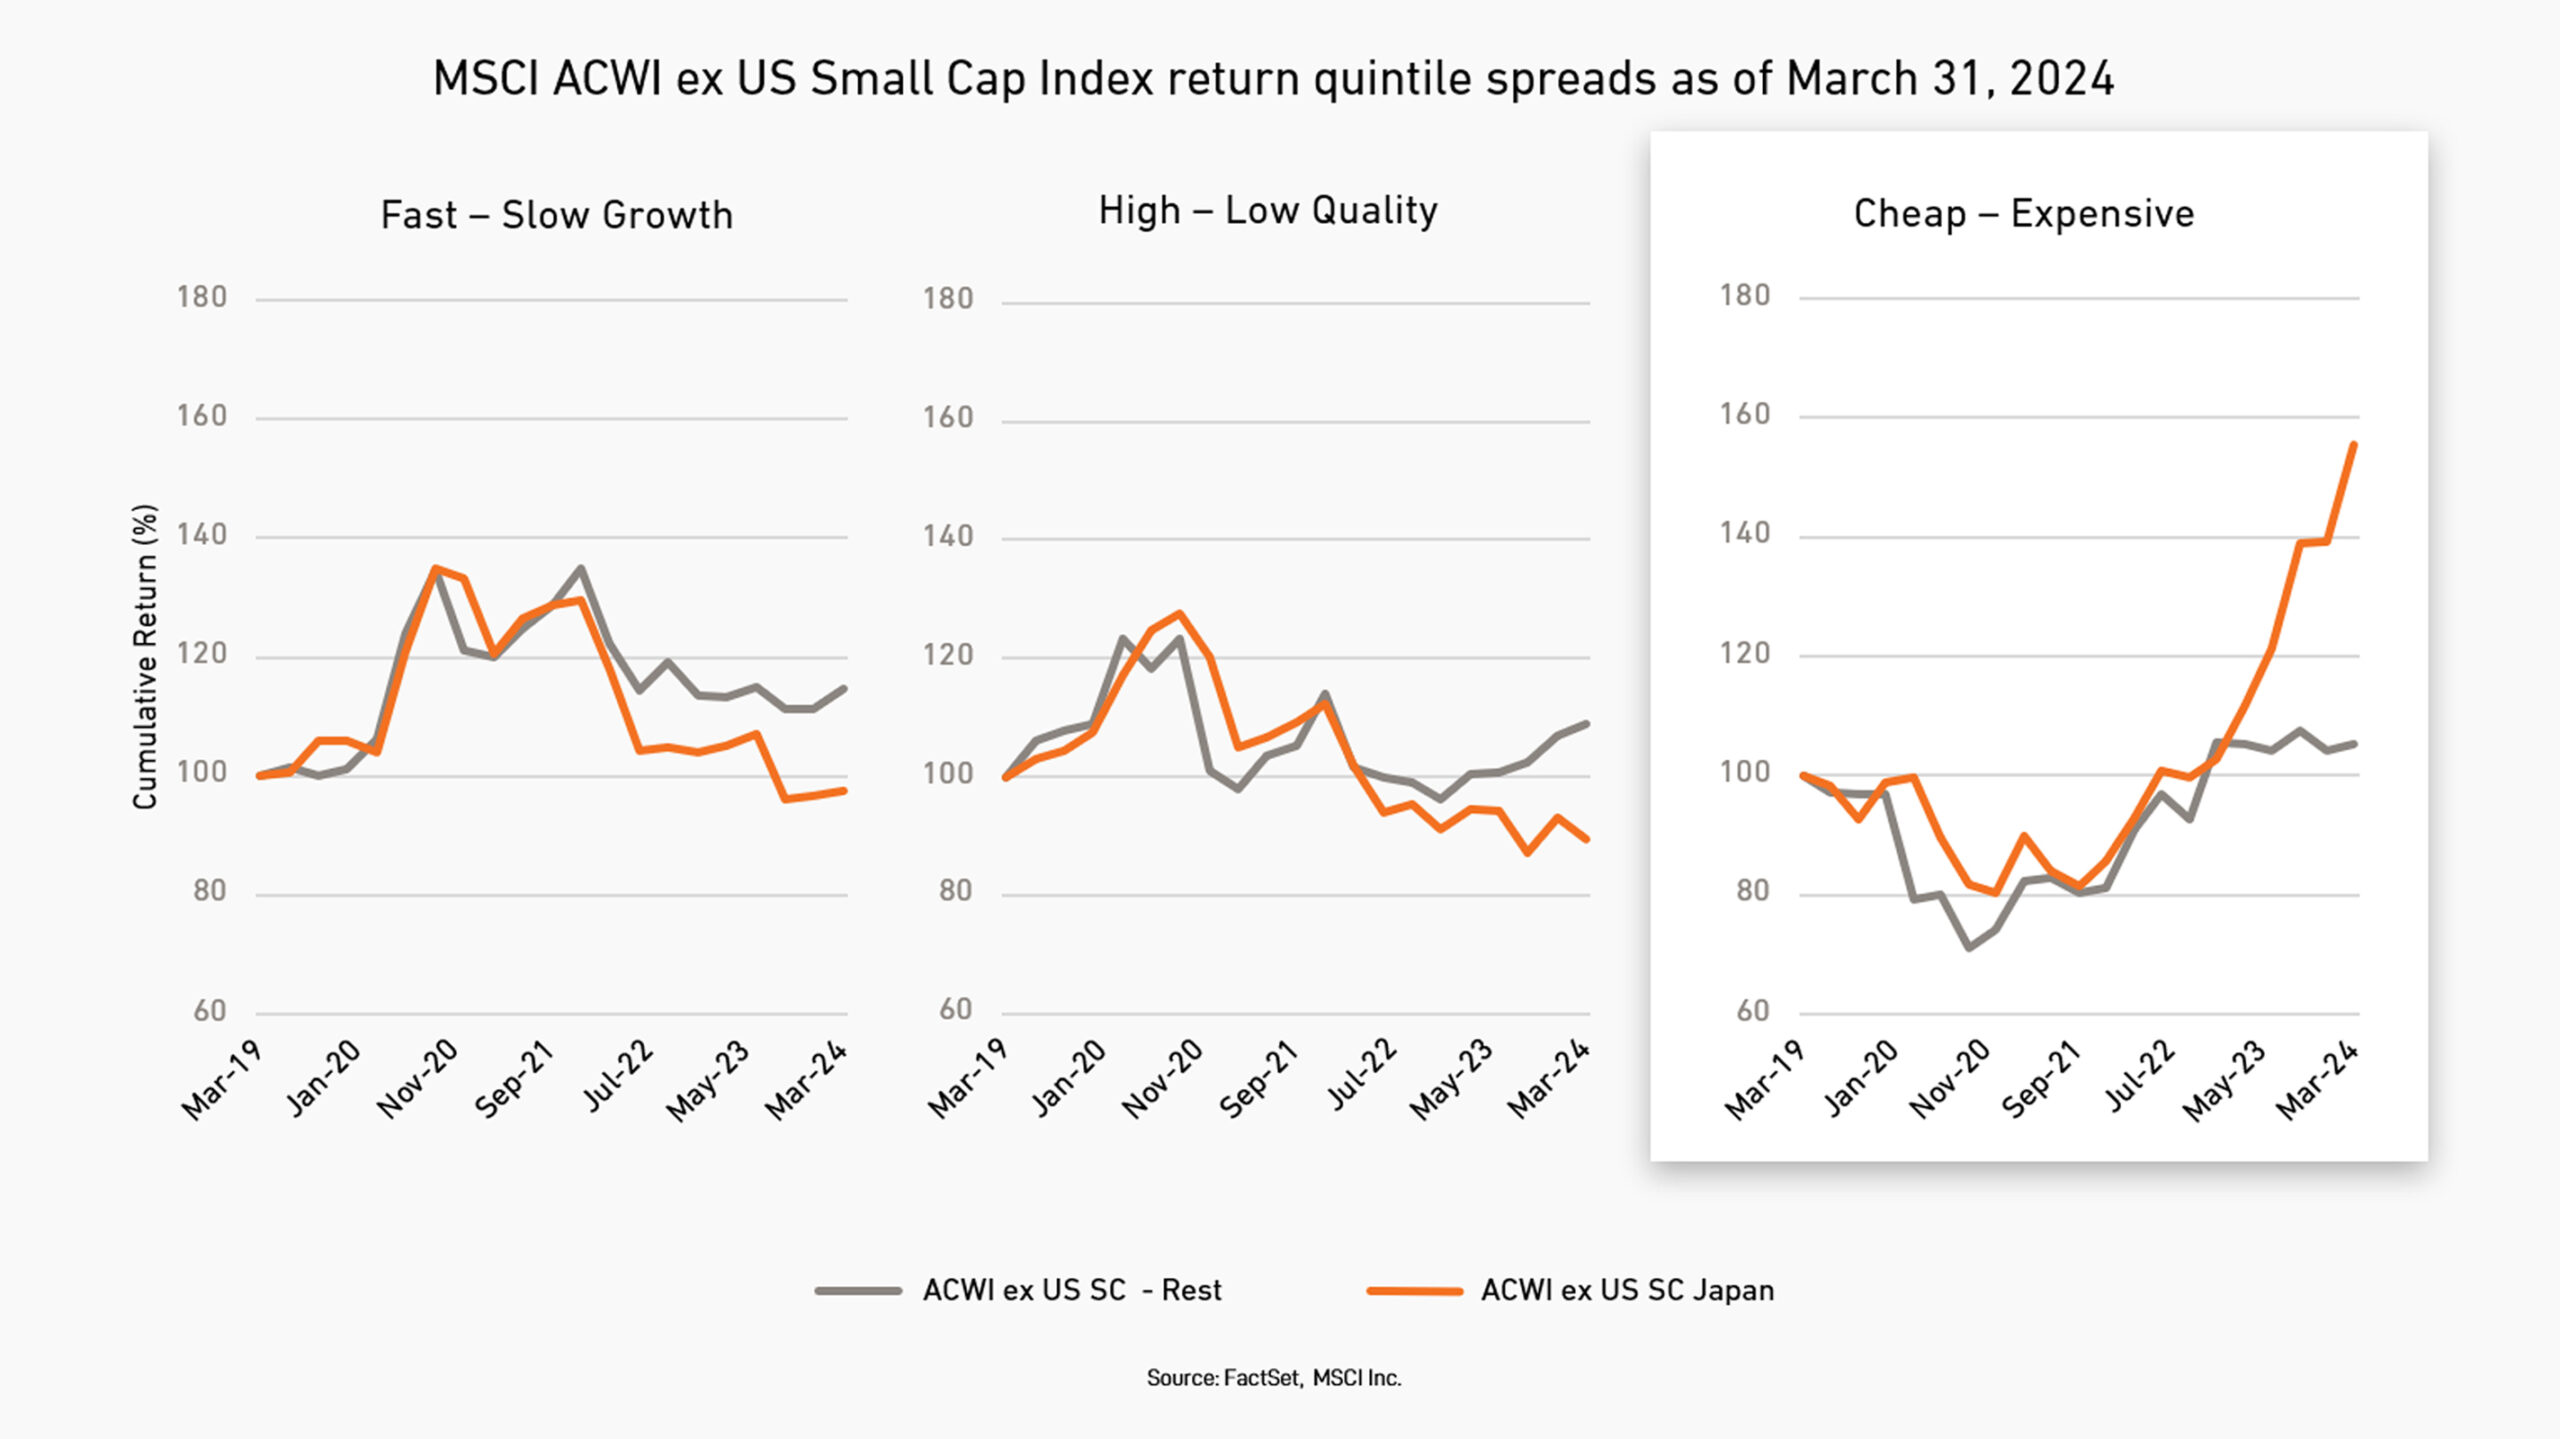
Three line charts showing MSCI ACWI ex US Small Cap Index return spreads by quintiles of growth, quality, and value as of March 31, 2024, highlighting Japan's value rally.

Japan’s Reforms Lift Stocks of Lowest-Quality Companies

Japan remains the single-largest country weight in the MSCI All Country World ex US Small Cap Index. However, the country’s weak economic growth, aging population, tight labor conditions, and chronic deflation have long made it a challenge to find high-quality, growing companies there.

Government regulators and the Tokyo Stock Exchange recently introduced a flurry of reforms aimed at improving corporate governance and shareholder returns. As discussed in our fourth quarter 2023 report, these actions have primarily benefited the cheapest stocks, given that they are typically associated with the least-profitable and slowest-growing companies. Additionally, the Bank of Japan has raised short-term interest rates, ending its decade-long era of negative rates. This landmark move boosted Japanese value stocks in the first quarter, further exacerbating the region’s style headwinds.

As the chart above to the right shows, the cheapest stocks in Japan outperformed the most expensive by nearly 1,600 basis points in the first quarter. For the trailing 12-month period, it’s worse: The spread between the most expensive and cheapest quintile was nearly 46%. The left and center charts show that investors also have favored slower-growing and lower-quality companies.

We don’t know how long this value rally will persist. In the short run, some of the changes have clearly exacerbated, and could prolong, style headwinds for higher-quality, faster-growing companies. But over the long term, the changes in Japanese business policy and mindset are positive developments. As more businesses raise their standards, the number of high-quality companies in Japan may increase.

Stylized graphic showing four different flowers.

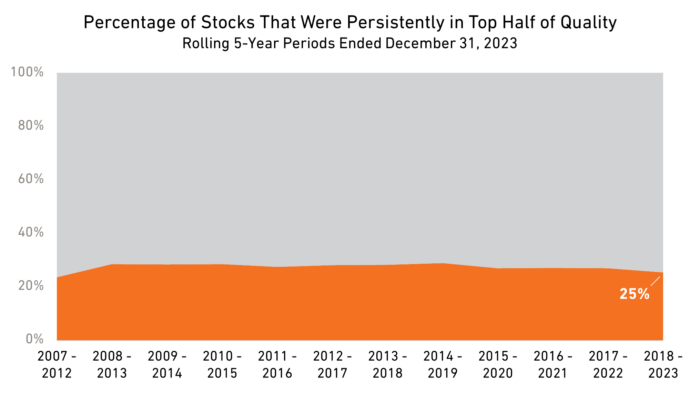
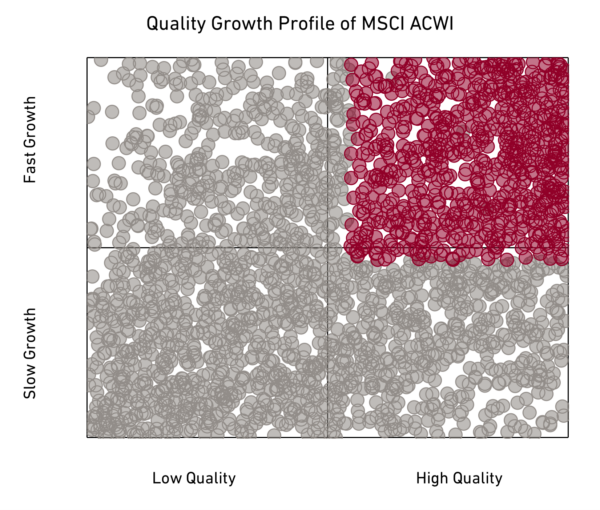
How Persistent Are Quality and Growth?

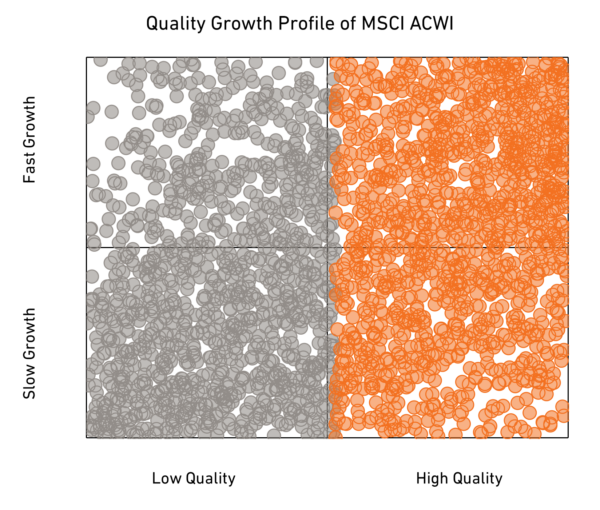
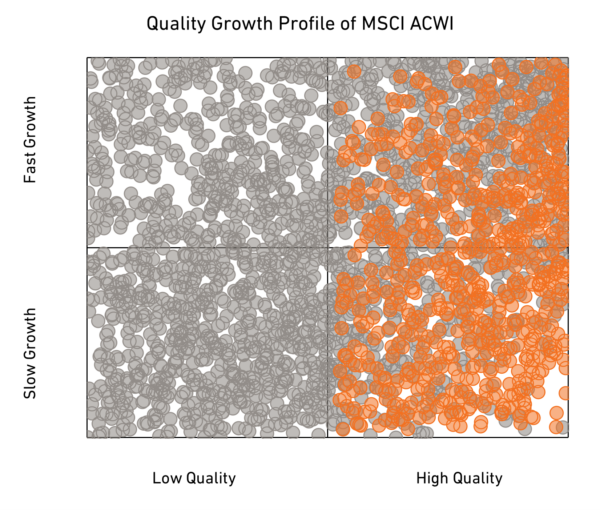
At Harding Loevner, we are quality growth investors, which means we seek to invest in well-managed, financially sound businesses that can sustain profitable growth across economic cycles. But what do we mean when we talk about quality and growth as attributes of a company? While there is no standard definition of quality or growth in the investing world, our quality rankings consider factors such as the stability, level, and trend of a company’s profitability as well as its balance-sheet strength, and our growth rankings consider historical and estimated future changes in sales, earnings, and cash flows.

How companies perform on those measures can change over time. Industry dynamics evolve, which can lead to a shift in competitive positioning. Macroeconomic cycles and deviations in management strategy can also alter the long-term outlook. Even companies that consistently rank highly for quality and growth must be continuously assessed for signs of deterioration in their financial health, competitive advantages, and other factors. The challenge isn’t just determining the businesses that meet our criteria today, but also which businesses will sustain their quality and growth characteristics over the long run.

Low Debt Companies Fare Better in High Interest Rate Times

Portfolio manager Andrew West, CFA, explains how selecting companies with strong balance sheets and low debt safeguards against the potential erosion of the value when interest rates are elevated.

Stylized portrait of Peter Baughan, Analyst and Portfolio Manager at Harding Loevner.

Down the Rabbit Hole

In trying to make sense of the state of things today, I found myself thinking of snippets I’ve heard from Lewis Carroll’s Alice in Wonderland. Until recently, however, I had never actually read the story. So, I went to Amazon.com and ordered a copy of the entire Alice in Wonderland Collection (Alice’s Adventures UndergroundAlice’s Adventures in WonderlandAlice Through the Looking Glass, and The Hunting of the Snark). While I was underwhelmed by the character development in these stories, I did find some takeaways that seem relevant today. Still, perhaps the most provocative line from Alice that I came across is one that was written not by Lewis Carroll but by Czech film director Jan Švankmajer for his 1988 film Alice.

The film opens with Alice saying, in part, “But, I nearly forgot, you must close your eyes otherwise you won’t see anything.” After all, Alice would never have experienced Wonderland or journeyed through the looking glass if she had not closed her eyes. And we’d have no Mad Hatter, no March Hare, and, of course, no Red Queen.

Receive our investment updates in your inbox.
Quarterly Commentaries
Monthly Reports
Quarterly Webcast Schedule
Insights from our Investment Team
Company HLHP
Opt-In Confirmation*
 

*By checking “Opt-In Confirmation,” you consent to receive investment updates from Harding Loevner. You can withdraw your consent at any time. Contact us.

Disclosures

“Out of Our Minds” presents the individual viewpoints of members of Harding Loevner on a range of investment topics. For more detailed information regarding particular investment strategies, please visit our website, www.hardingloevner.com. Any views expressed by employees of Harding Loevner are solely their own.

The information provided is as of the publication date and may be subject to change. Harding Loevner may currently hold or has previously held positions in the securities referenced, but there is no guarantee that Harding Loevner currently owns, or has ever owned, the securities mentioned herein. If Harding Loevner owns any of these securities, it may sell them at any time.

Any discussion of specific securities is not a recommendation to purchase or sell a particular security. Non-performance based criteria have been used to select the securities discussed. It should not be assumed that investment in the securities discussed has been or will be profitable. To request a complete list of holdings for the past year, please contact Harding Loevner.

There is no guarantee that any investment strategy will meet its objective. Past performance does not guarantee future results.

© 2025 Harding Loevner