Decorative art element Decorative art element Decorative art element

Out of
Our Minds

Ideas, arguments, and musings from inside Harding Loevner.
Four fuel pump nozzles at a Shell gas station, including three green and one red, each displaying the Shell logo.

The Surprising Case for Shell as a Quality-Growth Stock

Some sectors are packed with rapidly growing companies. Energy typically isn’t one of them—but that doesn’t mean some energy companies don’t deserve a place in a quality-growth portfolio.

It may seem like an odd fit at first blush, given that earnings in the Energy sector are notoriously volatile. Commodity prices can swing wildly, which not only affects energy producers’ revenues but also influences how much oil or gas they choose to pump out of the ground. Shell, for example, has exceeded a cash flow return on investment of 5% only once in the past 15 years, and its earnings are projected to remain flat over the next five. Even so, there are compelling reasons to own the stock. Here are a few:

Featured image for Brazil’s Market Is Thriving Amid Global Trade Shifts

Brazil’s Market Is Thriving Amid Global Trade Shifts

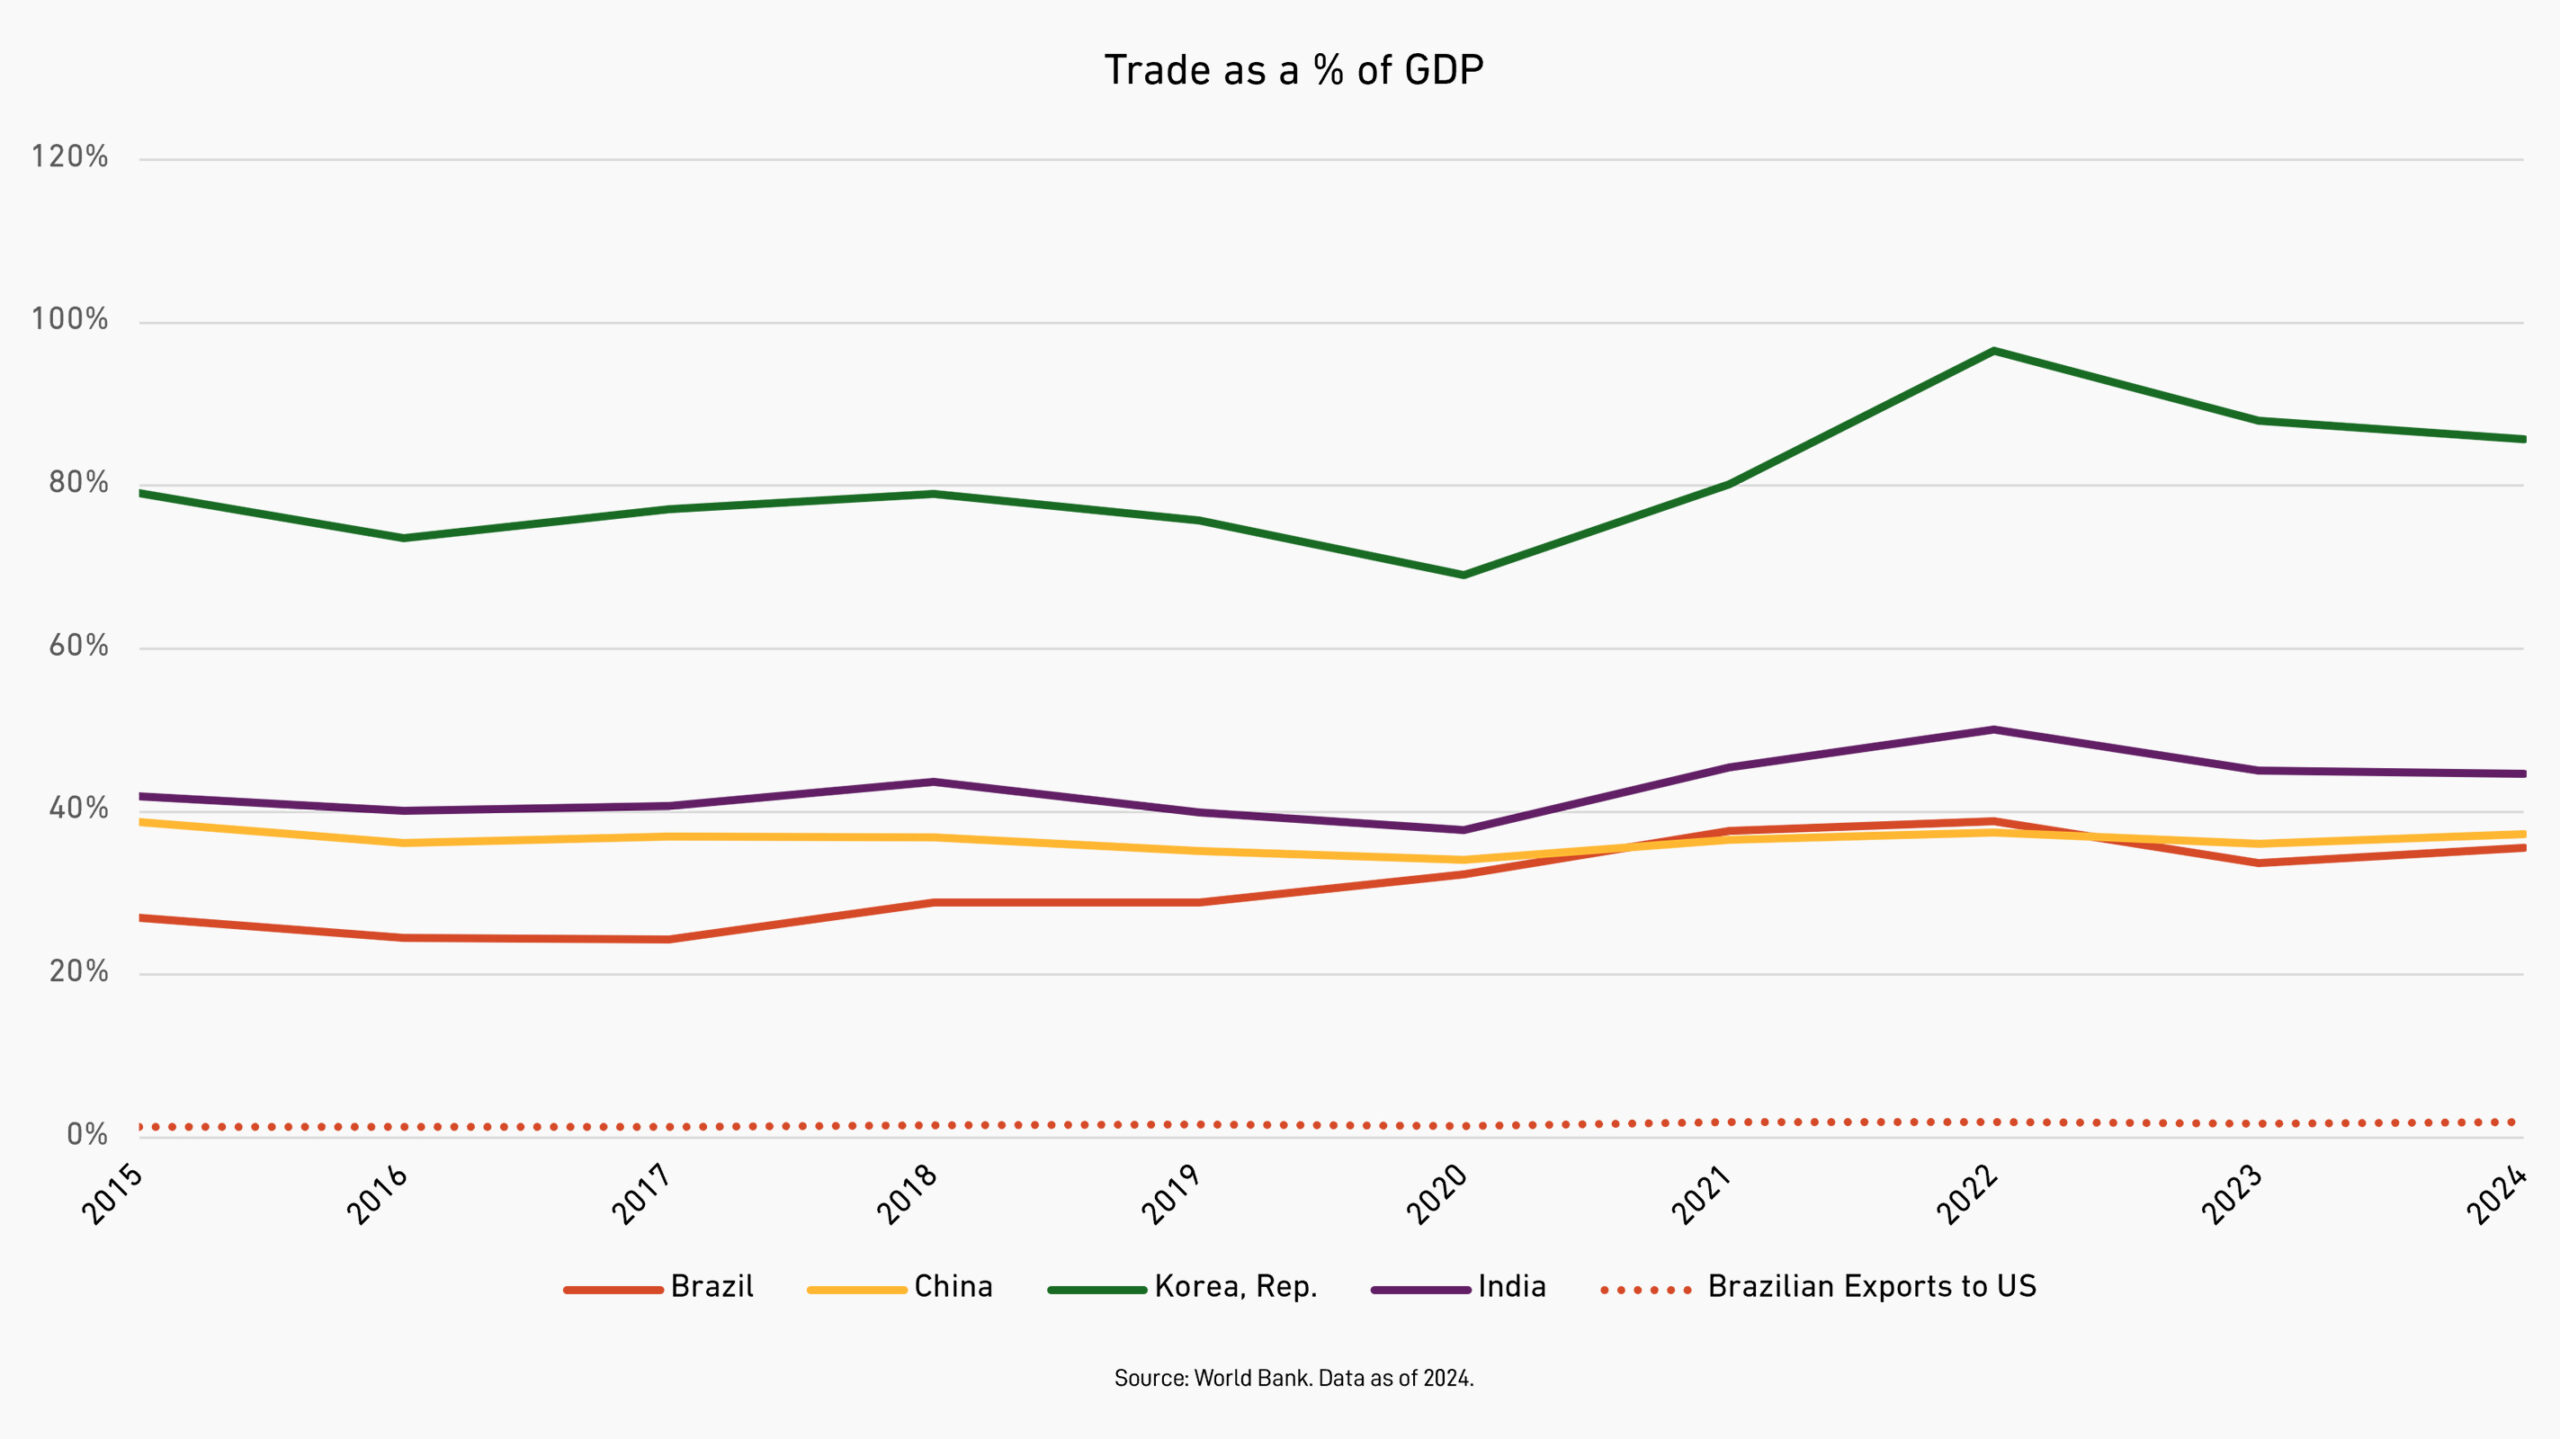
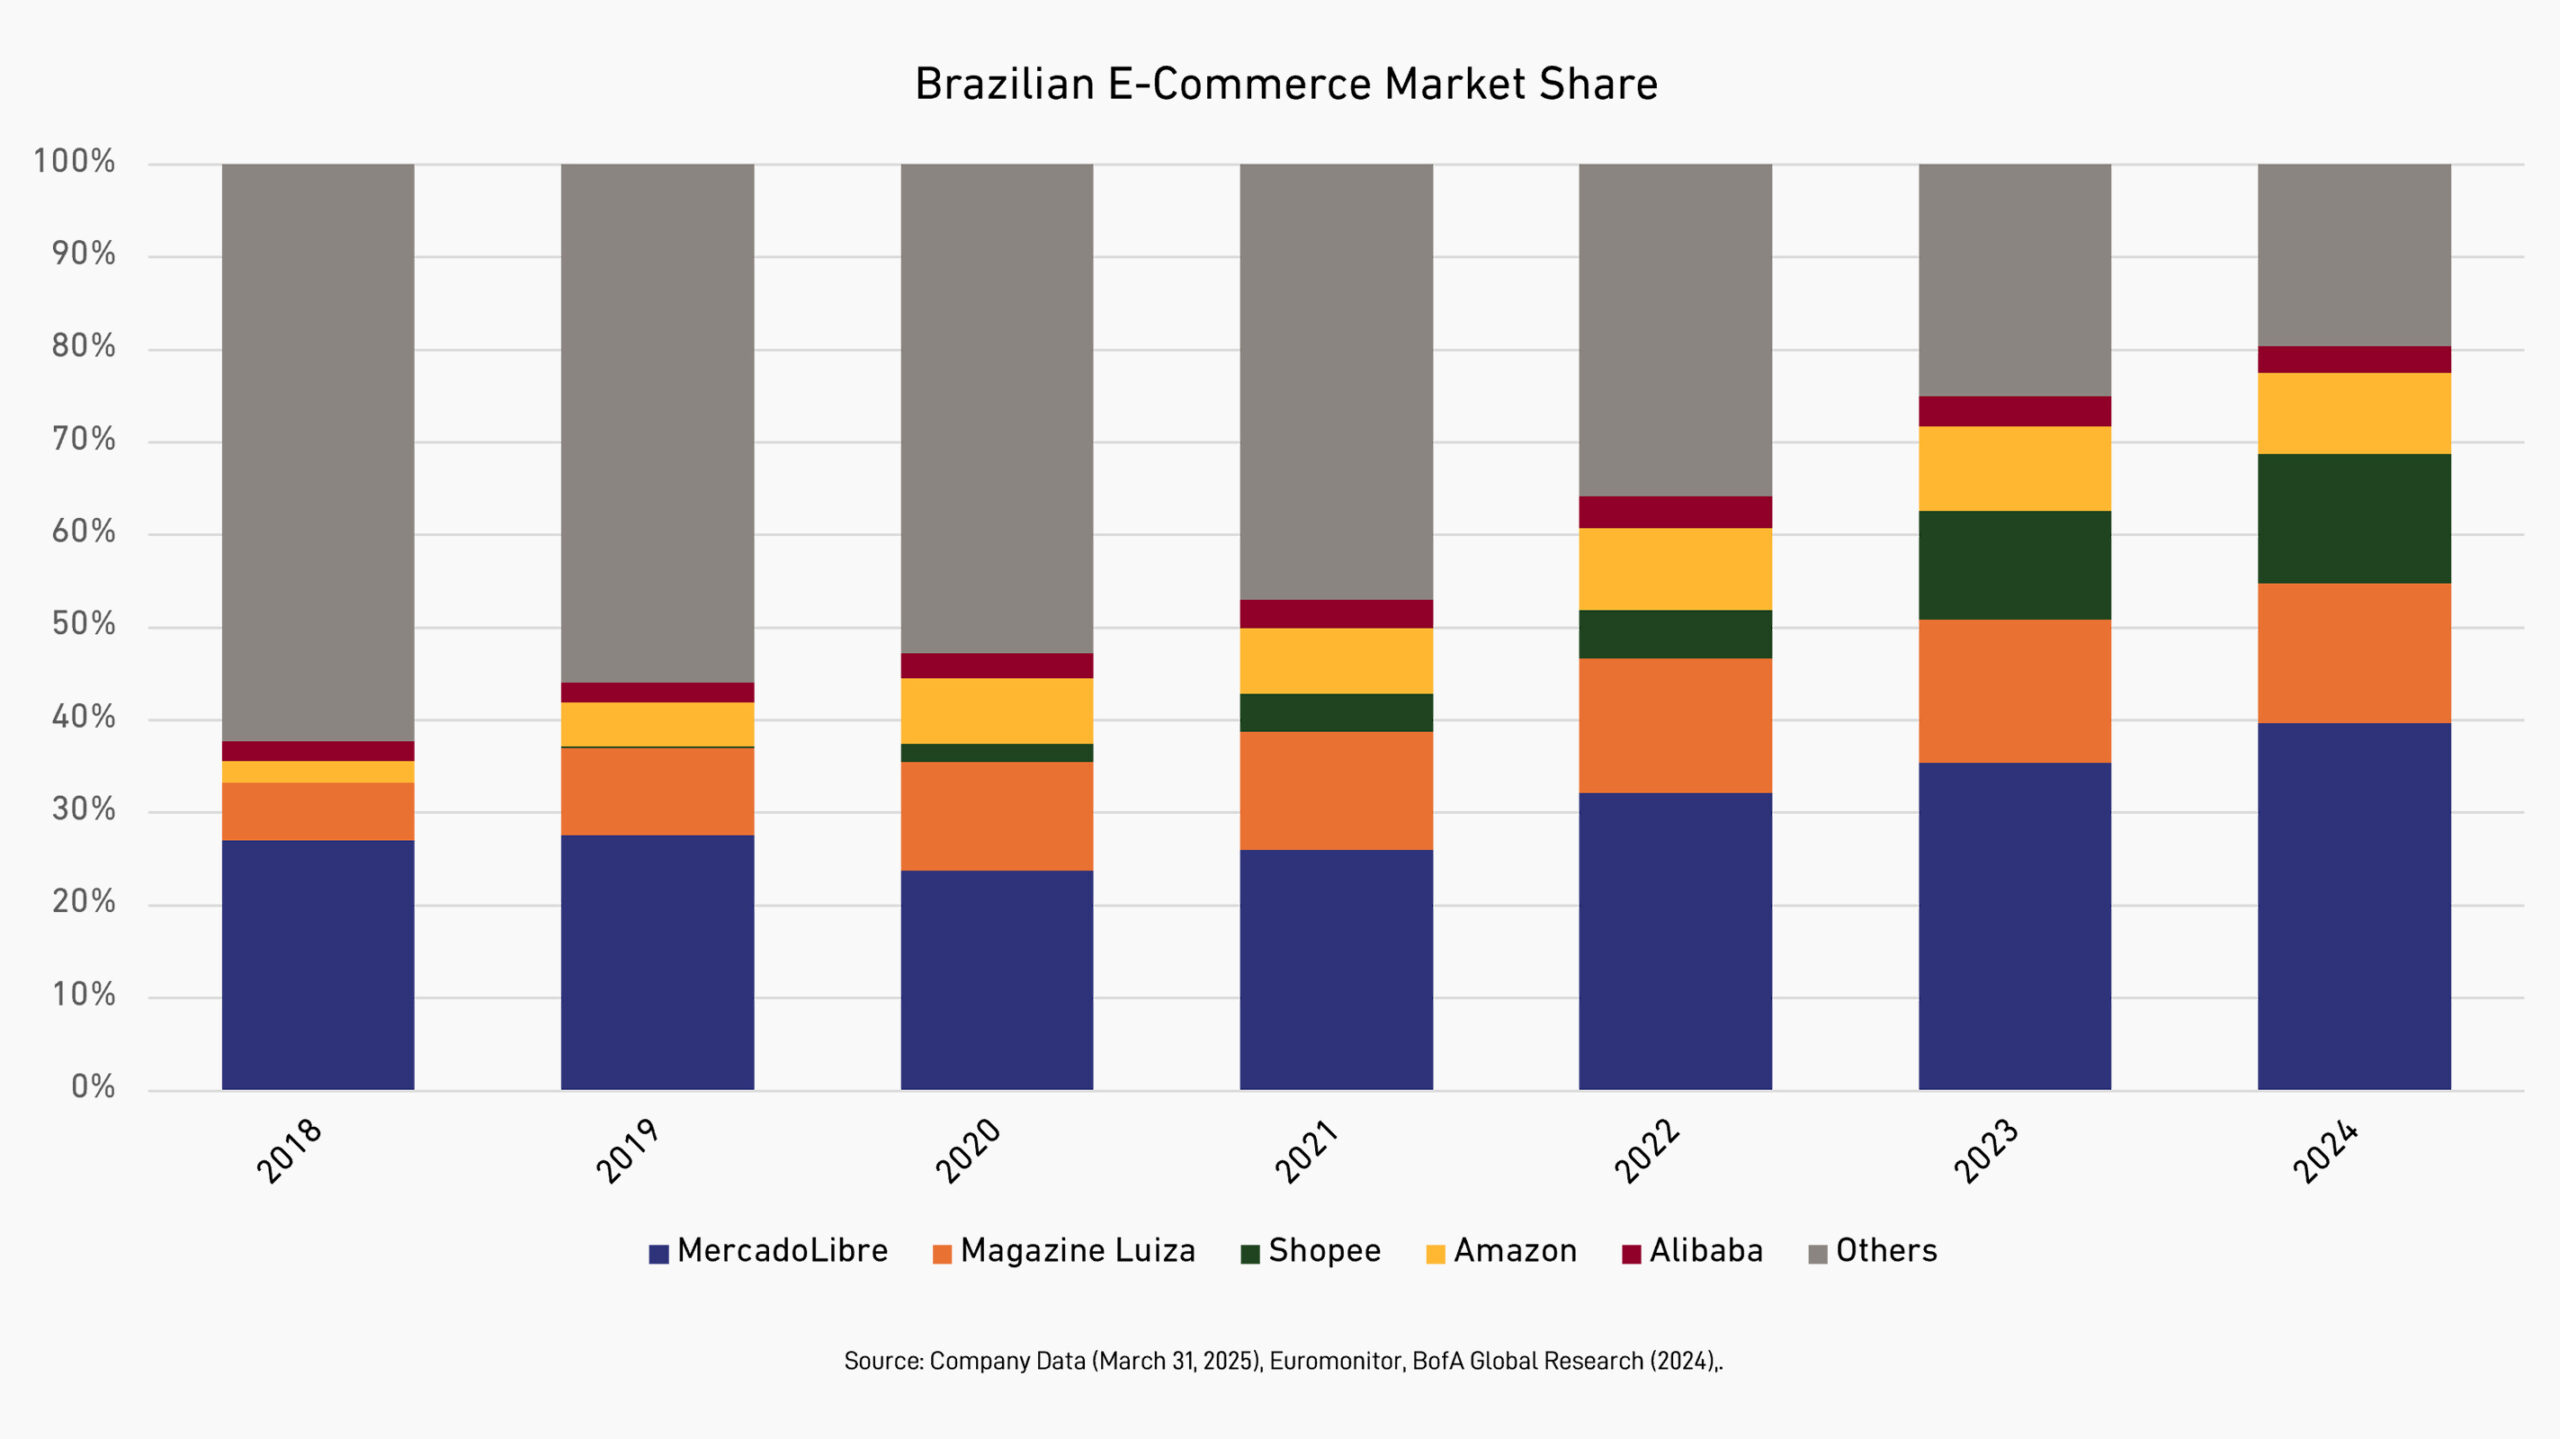
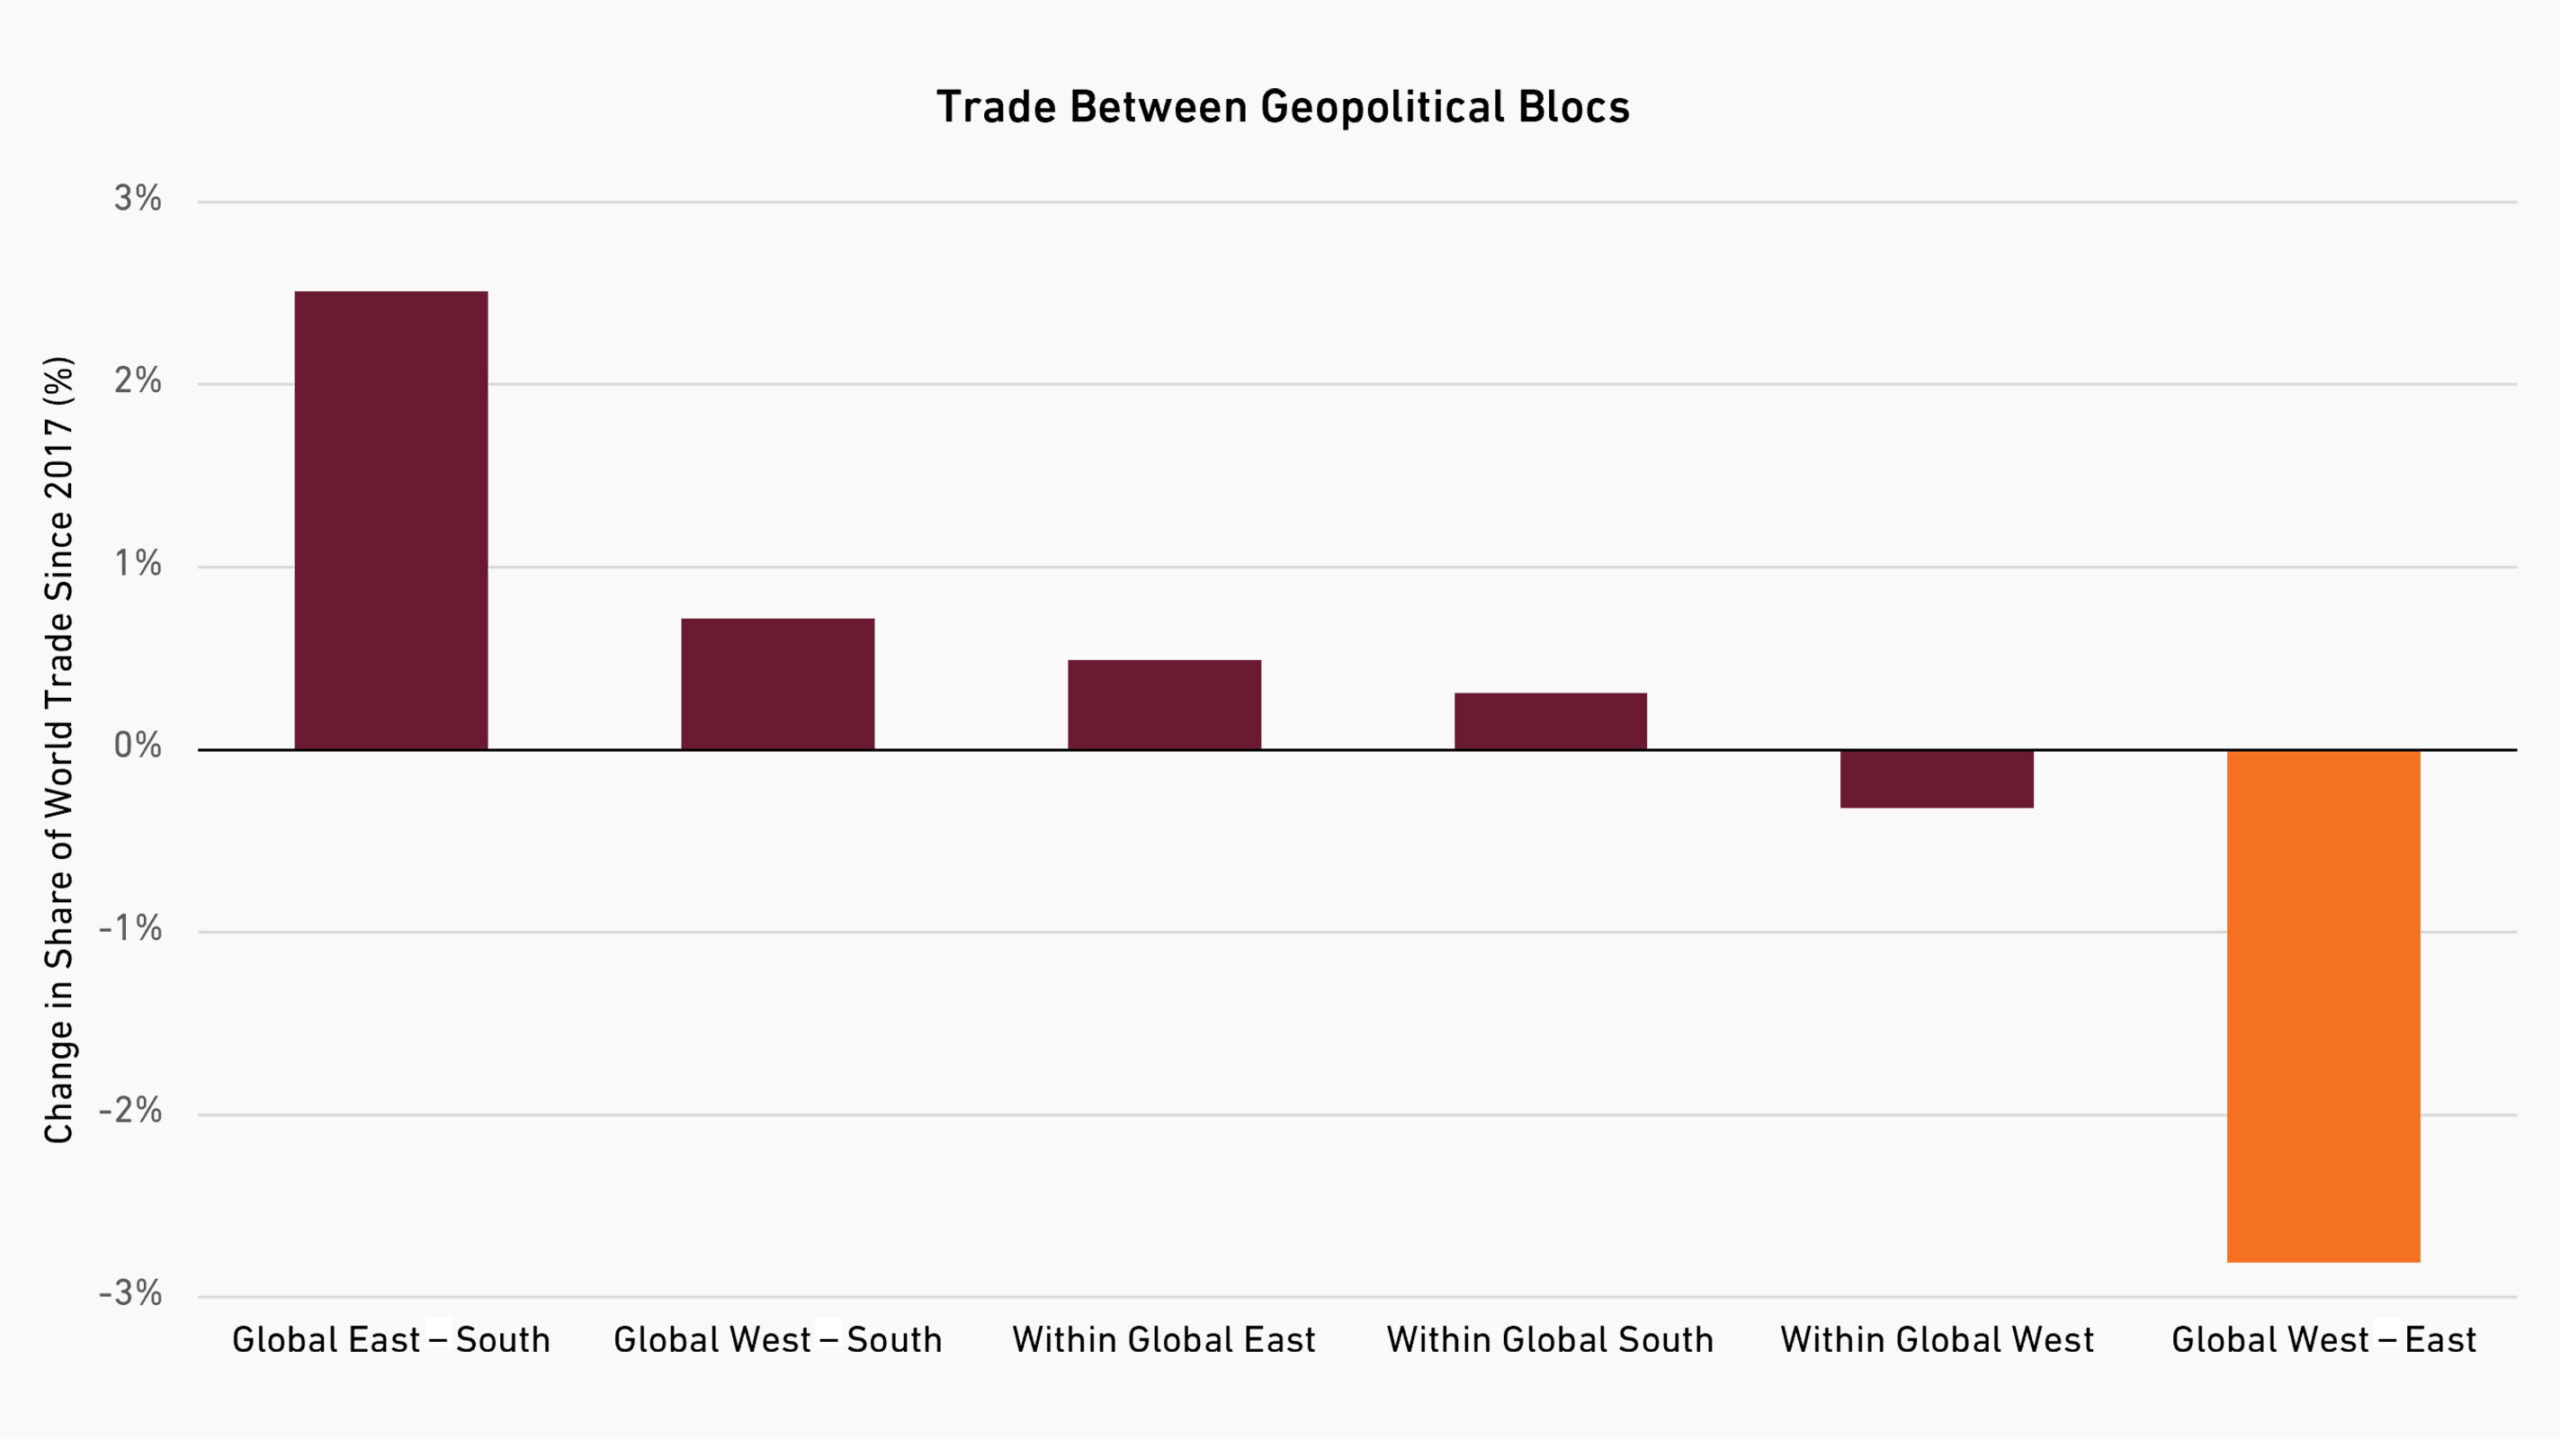
President Donald Trump’s trade wars have roiled global markets. Recently, he threatened Brazil with a 50% tariff unless the country drops an investigation into its former president. But the US trade war with the rest of the world hasn’t stopped trade. Indeed, for Brazil, its trade has increased since Trump’s first term, as seen in the chart above. Partially that is because Brazil’s exports to the US are only about 10% of its total exports and account for less than 2% of the country’s GDP.

Most of those exports are commodities such as oil, iron ore, beef, and coffee, all of which can easily be sold to other countries. And that is what has been happening. In fact, companies in Emerging Markets (EMs) around the world have responded to Trump’s trade wars by turning to other EMs as a replacement market.

Abstract red and orange graphic.

All Those AI ‘Agents’ Are Going to Need Security Credentials

One of the more immediate consequences of businesses and government entities increasingly trusting artificial intelligence (AI) with their data is security risk. An area of cybersecurity that may see greater demand because of AI is a niche known as identity and access management, which is Israel-based CyberArk’s specialty.

Featured image for Health Care Swoon Puts Sector’s Stable Profits on Discount

Health Care Swoon Puts Sector’s Stable Profits on Discount

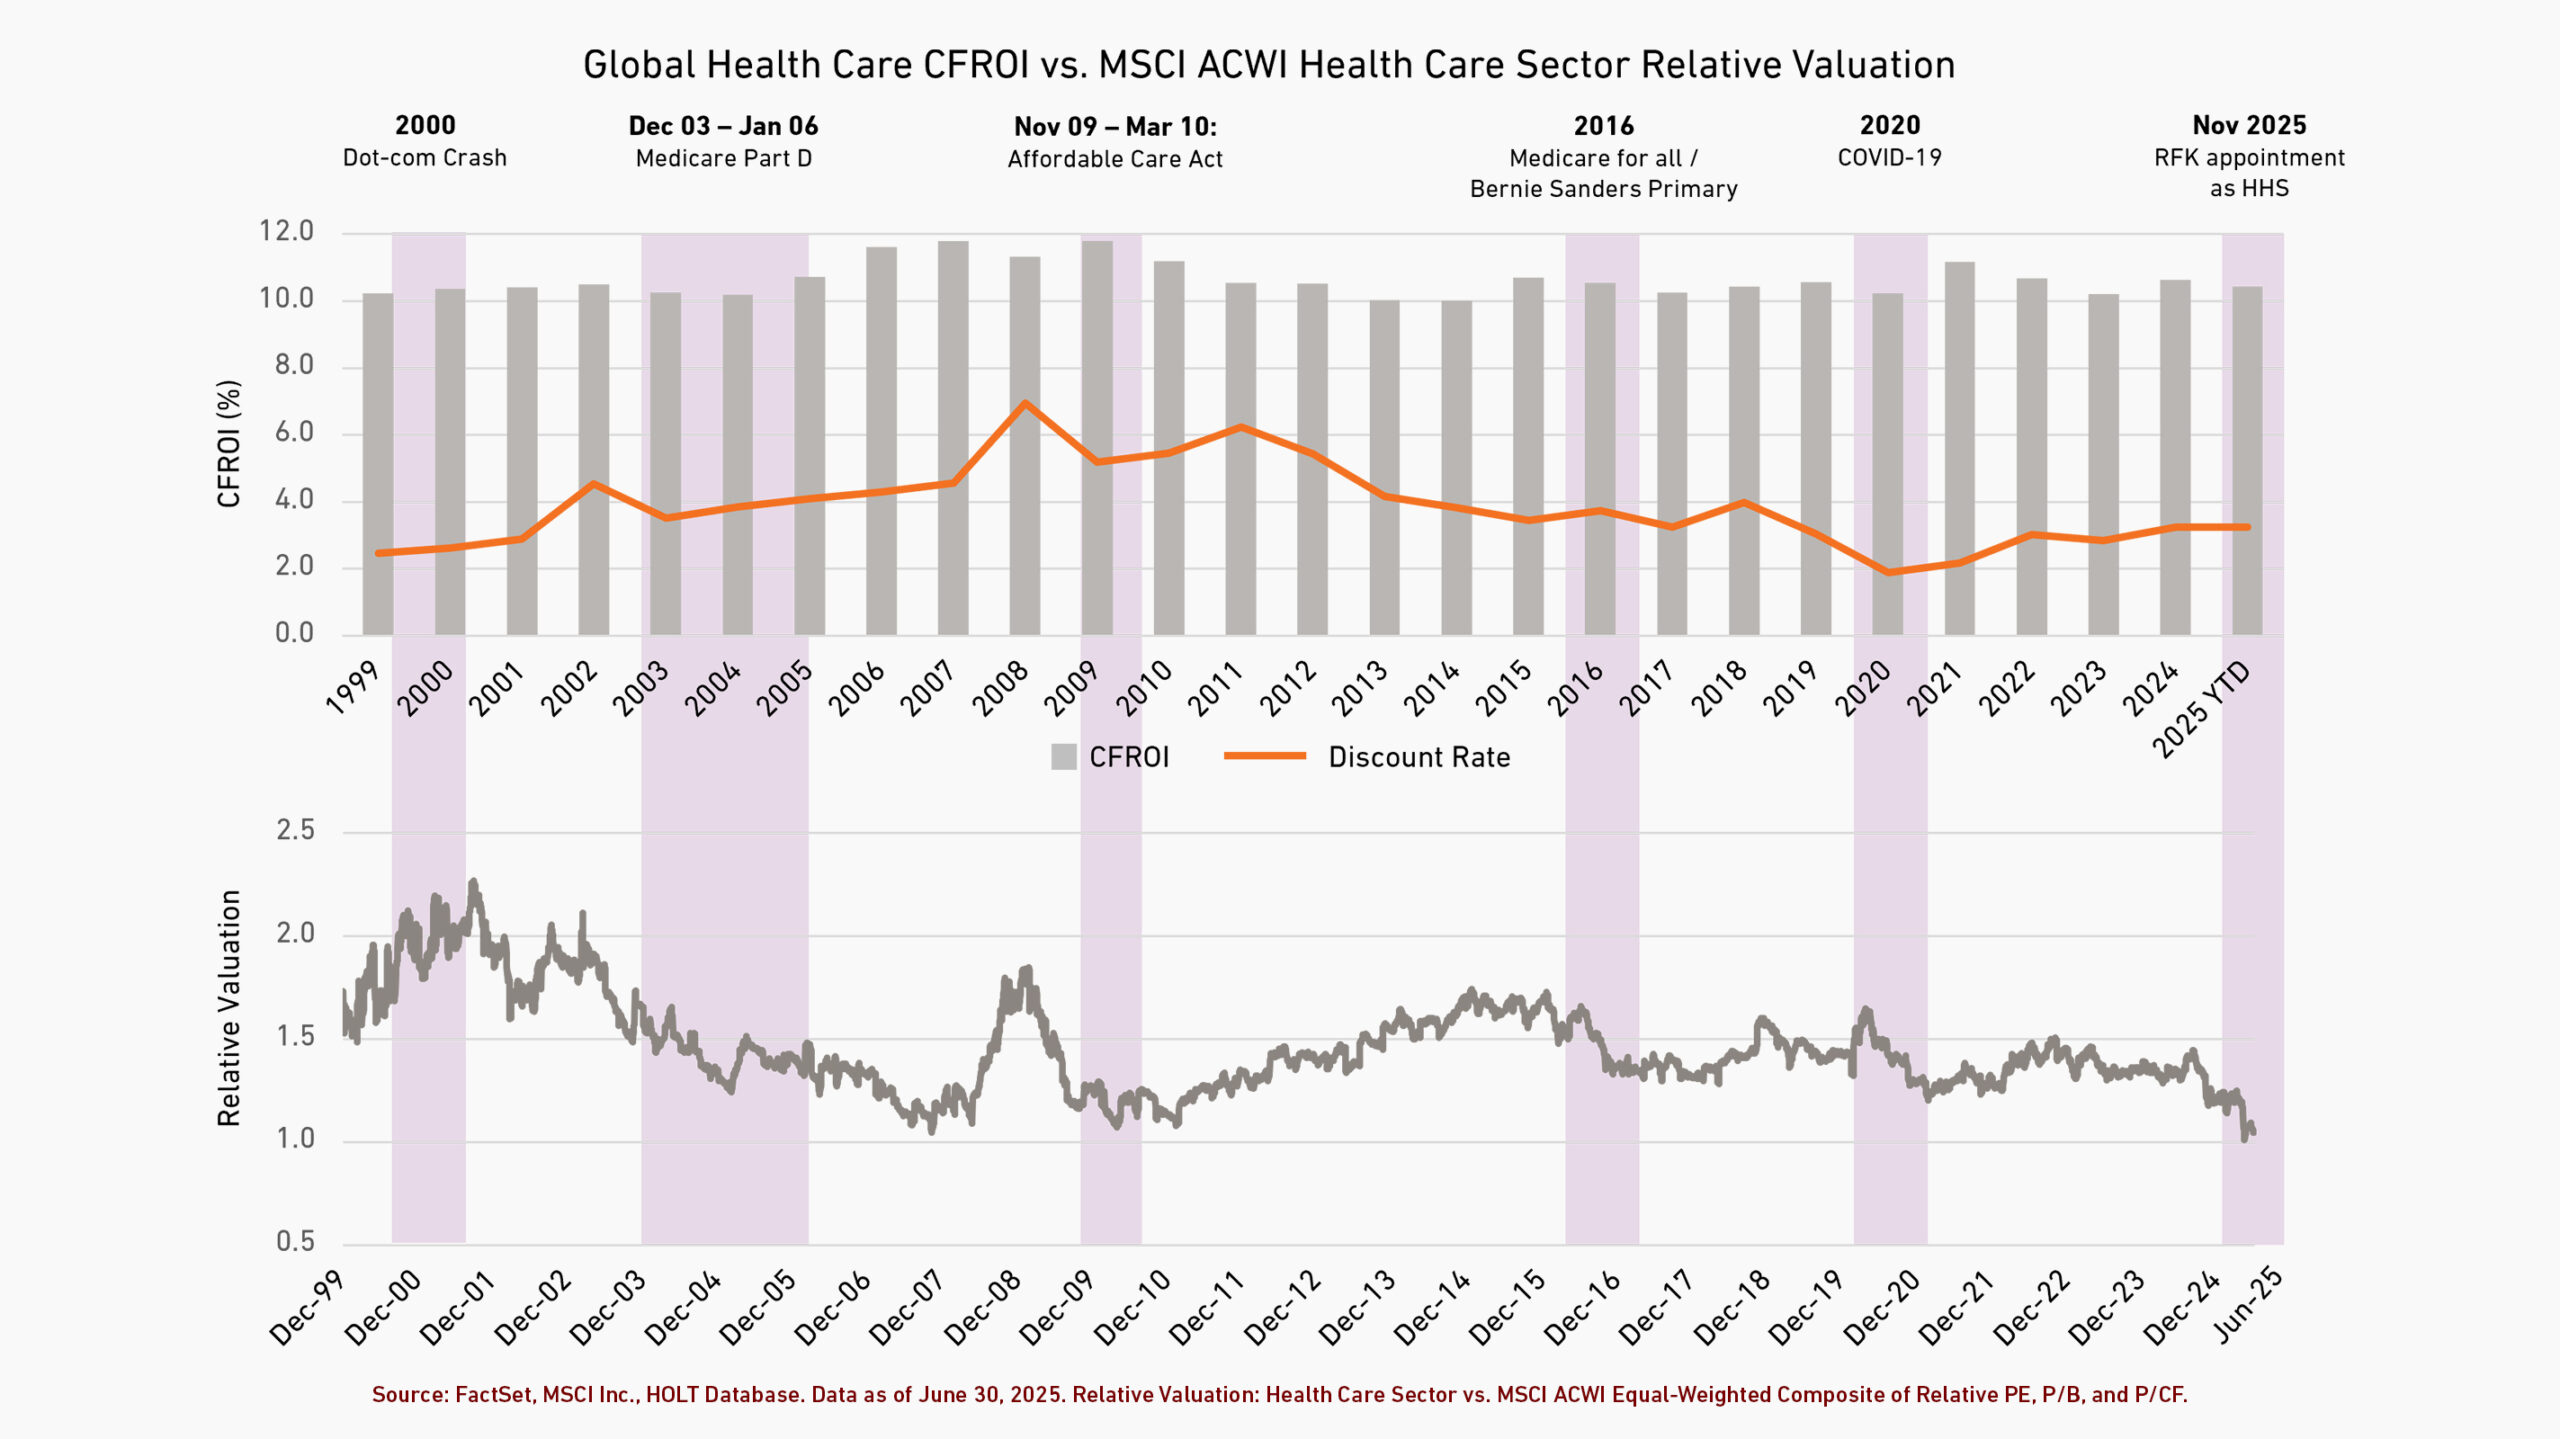
It was a bruising quarter for global Health Care stocks, with the sector underperforming the MSCI All Country World Index by the most in more than 25 years, as fears spread over shifting US policies and the country’s cuts to funding for medical research. But Health Care has weathered storms before.

In the chart above, the gray bars are the cash flow return on investment (CFROI) of companies in the sector for each year since 1999. The gray line is the sector’s average valuation—a blend of price-to-earnings, price-to-book, and price-to-cash-flow ratios—relative to the broader index. What the data show is that despite a series of political and regulatory developments that spooked investors (the portions shaded purple) over the past two-and-a-half decades—from the roll out of the Affordable Care Act to the COVID-19 pandemic—the profitability of the underlying businesses in the sector has been remarkably stable.

Health Care stocks are now trading at some of their most attractive levels relative to the broader market in decades. And while investor sentiment can be fragile, the long-term reasons to own Health Care companies remain intact, including that aging populations with unmet medical needs continue to fuel demand for treatment options.

Abstract red and orange graphic.

The Passive Paradox: Rethinking Risk in the Age of Index Investing

After getting its start almost half a century ago when Vanguard founder John Bogle launched the first S&P 500 index fund, passive investing is now the dominant force in global equity markets. The logic behind indexing is simple. On average, active managers deliver the market return before fees and trading costs; by reducing management fees and transaction costs associated with active trading, passive funds can reliably match average market returns and thus consistently outperform the average actively managed portfolio over time.

Although conceived as an alternative to active management, passive investing ultimately depends on it. Active managers interpret new information, earnings releases, economic data, industry shifts, and incorporate it into prices. This process of price discovery helps anchor valuations to fundamentals, limits mispricings, and curbs speculative excess, all of which are essential for orderly and resilient markets. Passive investors, in contrast, simply track indices, and trade only in response to investor flows or when index compositions change. As price-takers, they rely on active investors not only to establish fair pricing but also to provide liquidity and absorb trading flows—particularly during rebalancing or redemptions.

But as passive investing continues to grow—now representing over half of global equity markets by some estimates—it may be increasing the risks faced by active investors. With a shrinking pool of active investors responsible for price discovery and liquidity provision, their role becomes more concentrated and faces more potential volatility. If less capital is available to correct mispricings or absorb large trades from passive funds, markets could become more fragile, with sharper price swings and more persistent inefficiencies. In extreme cases, active managers may be forced to take on more risk to generate returns, operating in an environment where their role is constrained yet indispensable. As passive assets swell, does the burden on active management increase, making its role more precarious?

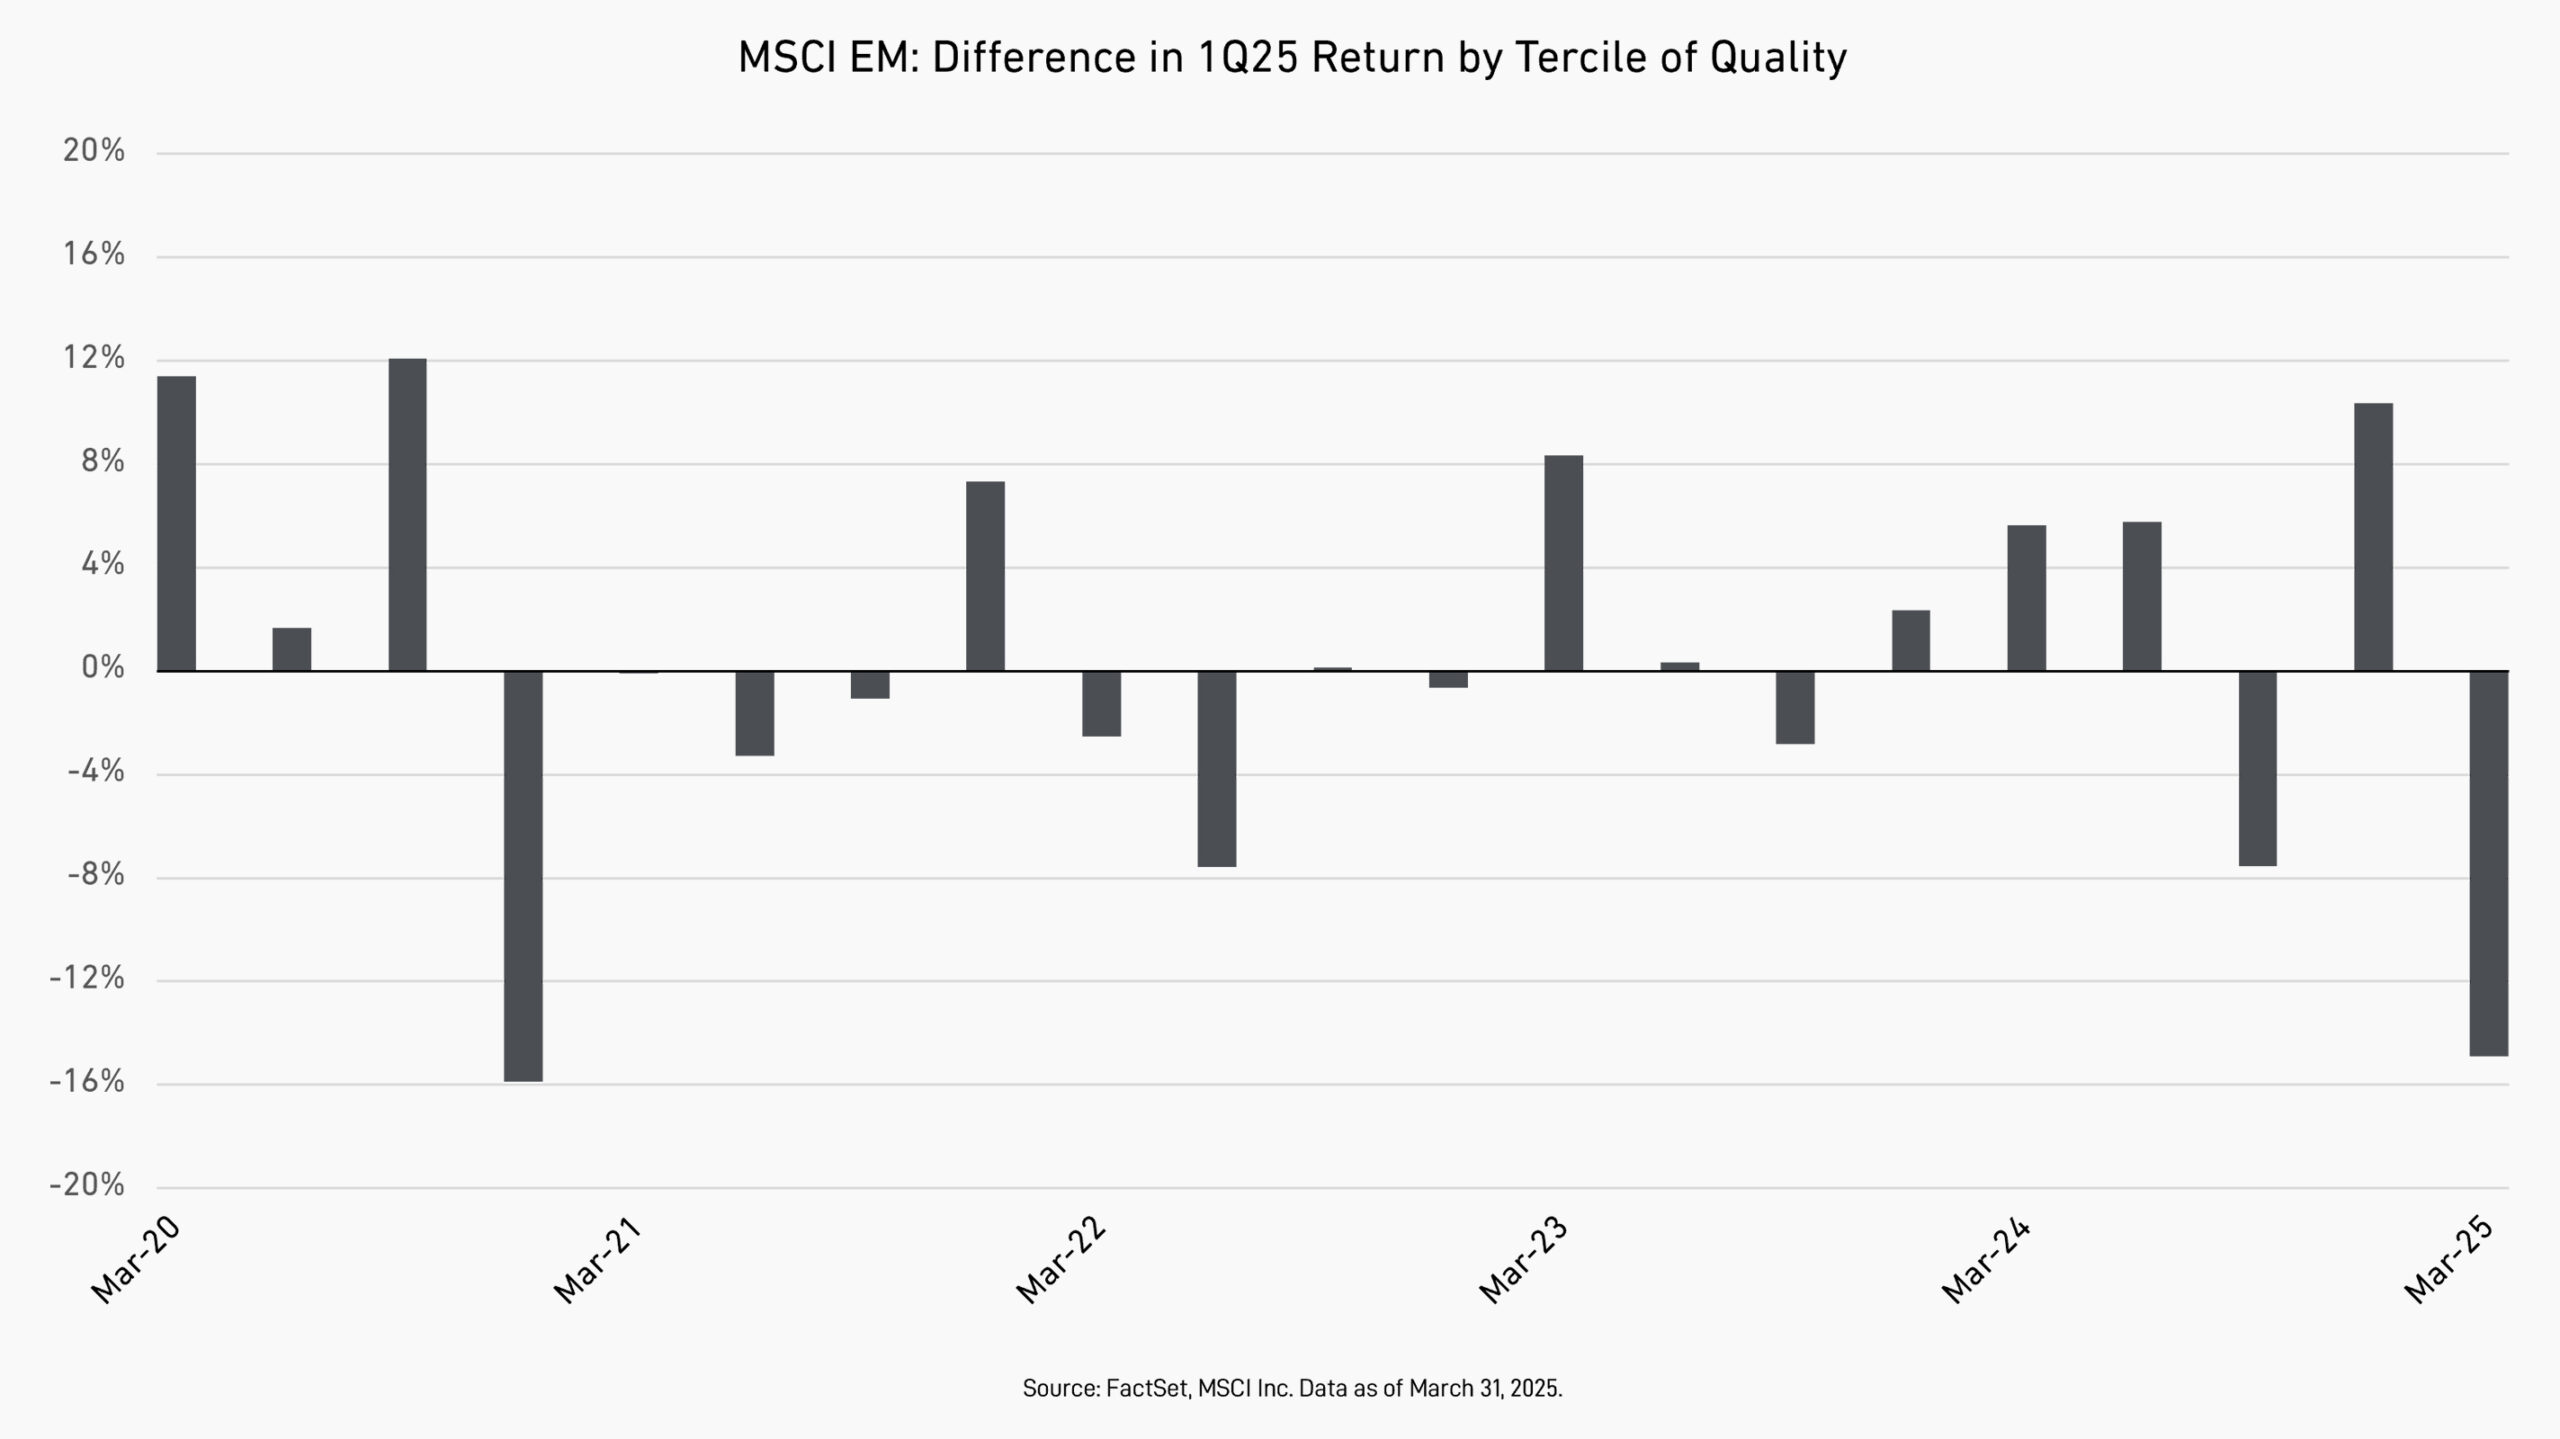
Column chart showing the difference in returns by tercile of quality in the MSCI EM index from March 2020 to March 2025.

DeepSeek, Weak Outlooks Drag on IT Companies in Emerging Markets

High-quality stocks had a very poor first quarter in Emerging Markets (EMs), primarily due to Information Technology (IT) stocks, which also tend to trade at higher valuations. Stocks in the top third of quality underperformed the lowest third by close to 15%, the kind of sharp sell-off last seen four years ago when companies were still coming out of the depths of the COVID-19 pandemic.

Within the IT sector, semiconductor and other hardware stocks linked to the AI value chain sold off sharply after Chinese AI-startup DeepSeek released a large language model that rivaled the leading models at a fraction of the training cost, raising concerns that AI-related capex spending may drop.

Additionally, shares of IT-services companies were also weak. Most reported fourth-quarter earnings in line with expectations but provided disappointing guidance for 2025, quashing hopes of an acceleration in demand this year. Of course, additional trade-related uncertainty has skyrocketed since the end of the first quarter as global markets convulsed sharply in the wake of Trump’s tariffs in early April (with North America being a large market for many EM-based IT companies).

Still, despite the short-term uncertainty, the advancement of new technologies has increased the long-term opportunities for high-quality and fast-growing EM IT companies.

Abstract red and orange graphic.

Perón’s Ghost: When Self-Reliance Becomes Self-Defeating

The following is adapted from our first-quarter report for the Global Equity strategy. Click here to read the full report.

Amid the turbulence and mixed signals of the Trump administration’s tariff strategy, a discernible tilt toward economic self-sufficiency has emerged. The stated objectives of reshoring manufacturing, reducing dependence on foreign supply chains, and projecting national strength carry political appeal for many, but undoing 50 years of globalization is fraught with risk. Argentina’s mid-20th century descent under Juan Perón offers a sobering reminder of how quickly such ambitious efforts can short-circuit, swapping prosperity for prolonged isolation and decline.

Juan Perón came to power on a wave of popular support, winning democratic elections in 1946 and 1951 with an economic agenda focused on achieving independence from foreign economic and political control. At the time, British and American investors dominated Argentina’s infrastructure, utilities, and key industries, while the nation’s reliance on imported manufactured goods and its commodity-based export economy left it vulnerable to external shocks and fluctuations in global demand.

Argentina’s mid-20th century descent under Juan Perón offers a sobering reminder of how quickly such ambitious efforts can short-circuit, swapping prosperity for prolonged isolation and decline.

In response, Perón’s government launched a program of economic nationalism centered around Import Substitution Industrialization, with high tariffs often reaching over 100% for some goods to protect fledgling domestic industries. These tariffs made foreign goods prohibitively expensive and gave local producers a captive market.

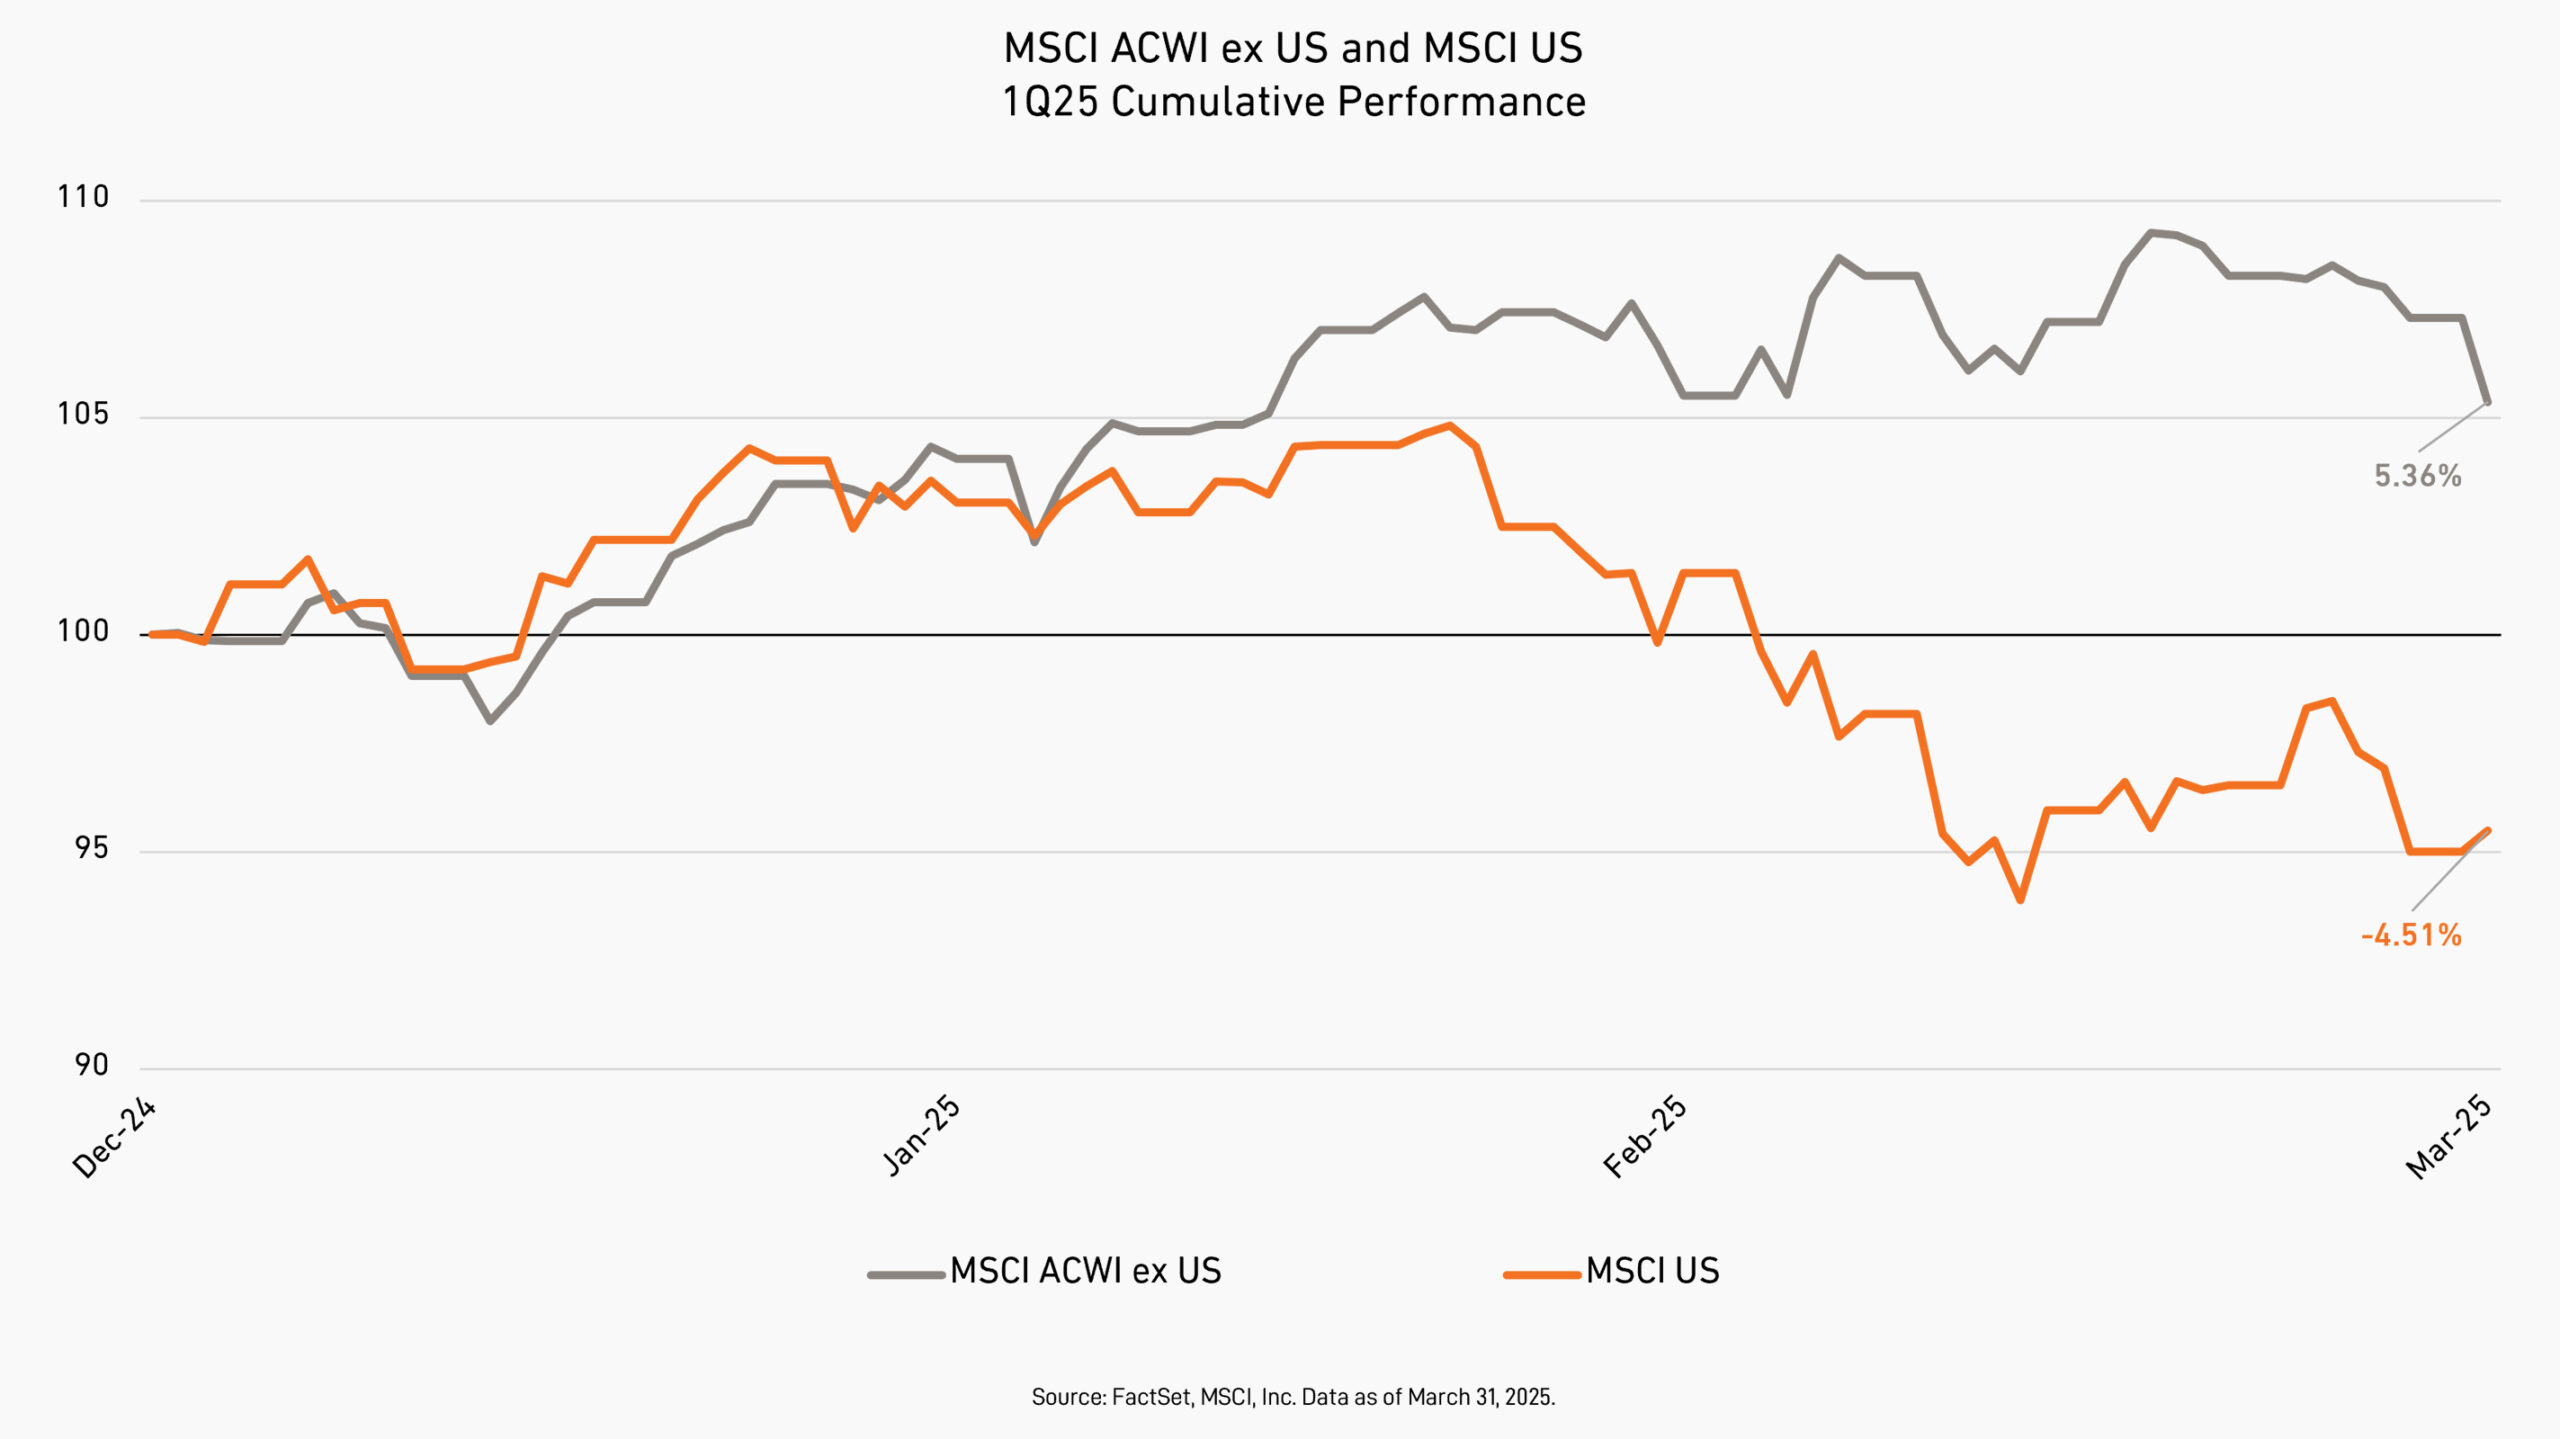
Line chart tracking cumulative index performance for MSCI ACWI ex US and MSCI US, highlighting convergence in global stock performance in 1Q 2025.

First Quarter Outperformance of Non-US Stocks At 15-year High

International markets continue to offer opportunities to own high-quality, growing businesses at levels supportive of higher future returns. Investors enjoyed a recently rare taste of that as international stocks rose in the first quarter, outperforming the US market more this quarter than it has in 15 years.

Abstract red and orange graphic.

Stop Making Sense: Echoes of Emerging Markets in Today’s US Policy

I…who took the money?
Who took the money away?
…it’s always showtime
Here at the edge of the stage
I, I, I wake up and wonder
What was the place, what was the name?
We wanna wait, but here we go again…

-Talking Heads, from the film Stop Making Sense


The following is adapted from our first-quarter report for the International Equity strategy. Click here to read the full report.

This quarter, global investors have had to grapple with heightened US policy uncertainty, most overtly in the realm of trade but in many other areas as well, from military cooperation to health care to the previous administrations’ industrial policy programs. As we cautioned in our fourth quarter 2024 letter, the US political climate has featured policy volatility almost from the outset of the Trump administration. But that chaos has been greater than we imagined, and the vectors of policy shifts have expanded beyond the “tariffs, tax cuts, and deportations” list that we expected.

Ex US Marks the Spot: Where future returns might be heading

Over the last 14 years, a powerful narrative around the exceptionalism of US equity markets took root. Dominant tech stocks, prolonged low interest rates, and economic stability led to higher returns for US stocks and caused many investors to question the necessity of international allocations. However, the tide has shifted in 2025; international equities have outperformed. Watch Portfolio Specialists Ray Vars, CFA, and Apurva Schwartz discuss the recent shift in market leadership and what the next decade might hold for global equity markets.

The transcript, lightly edited for clarity, follows.

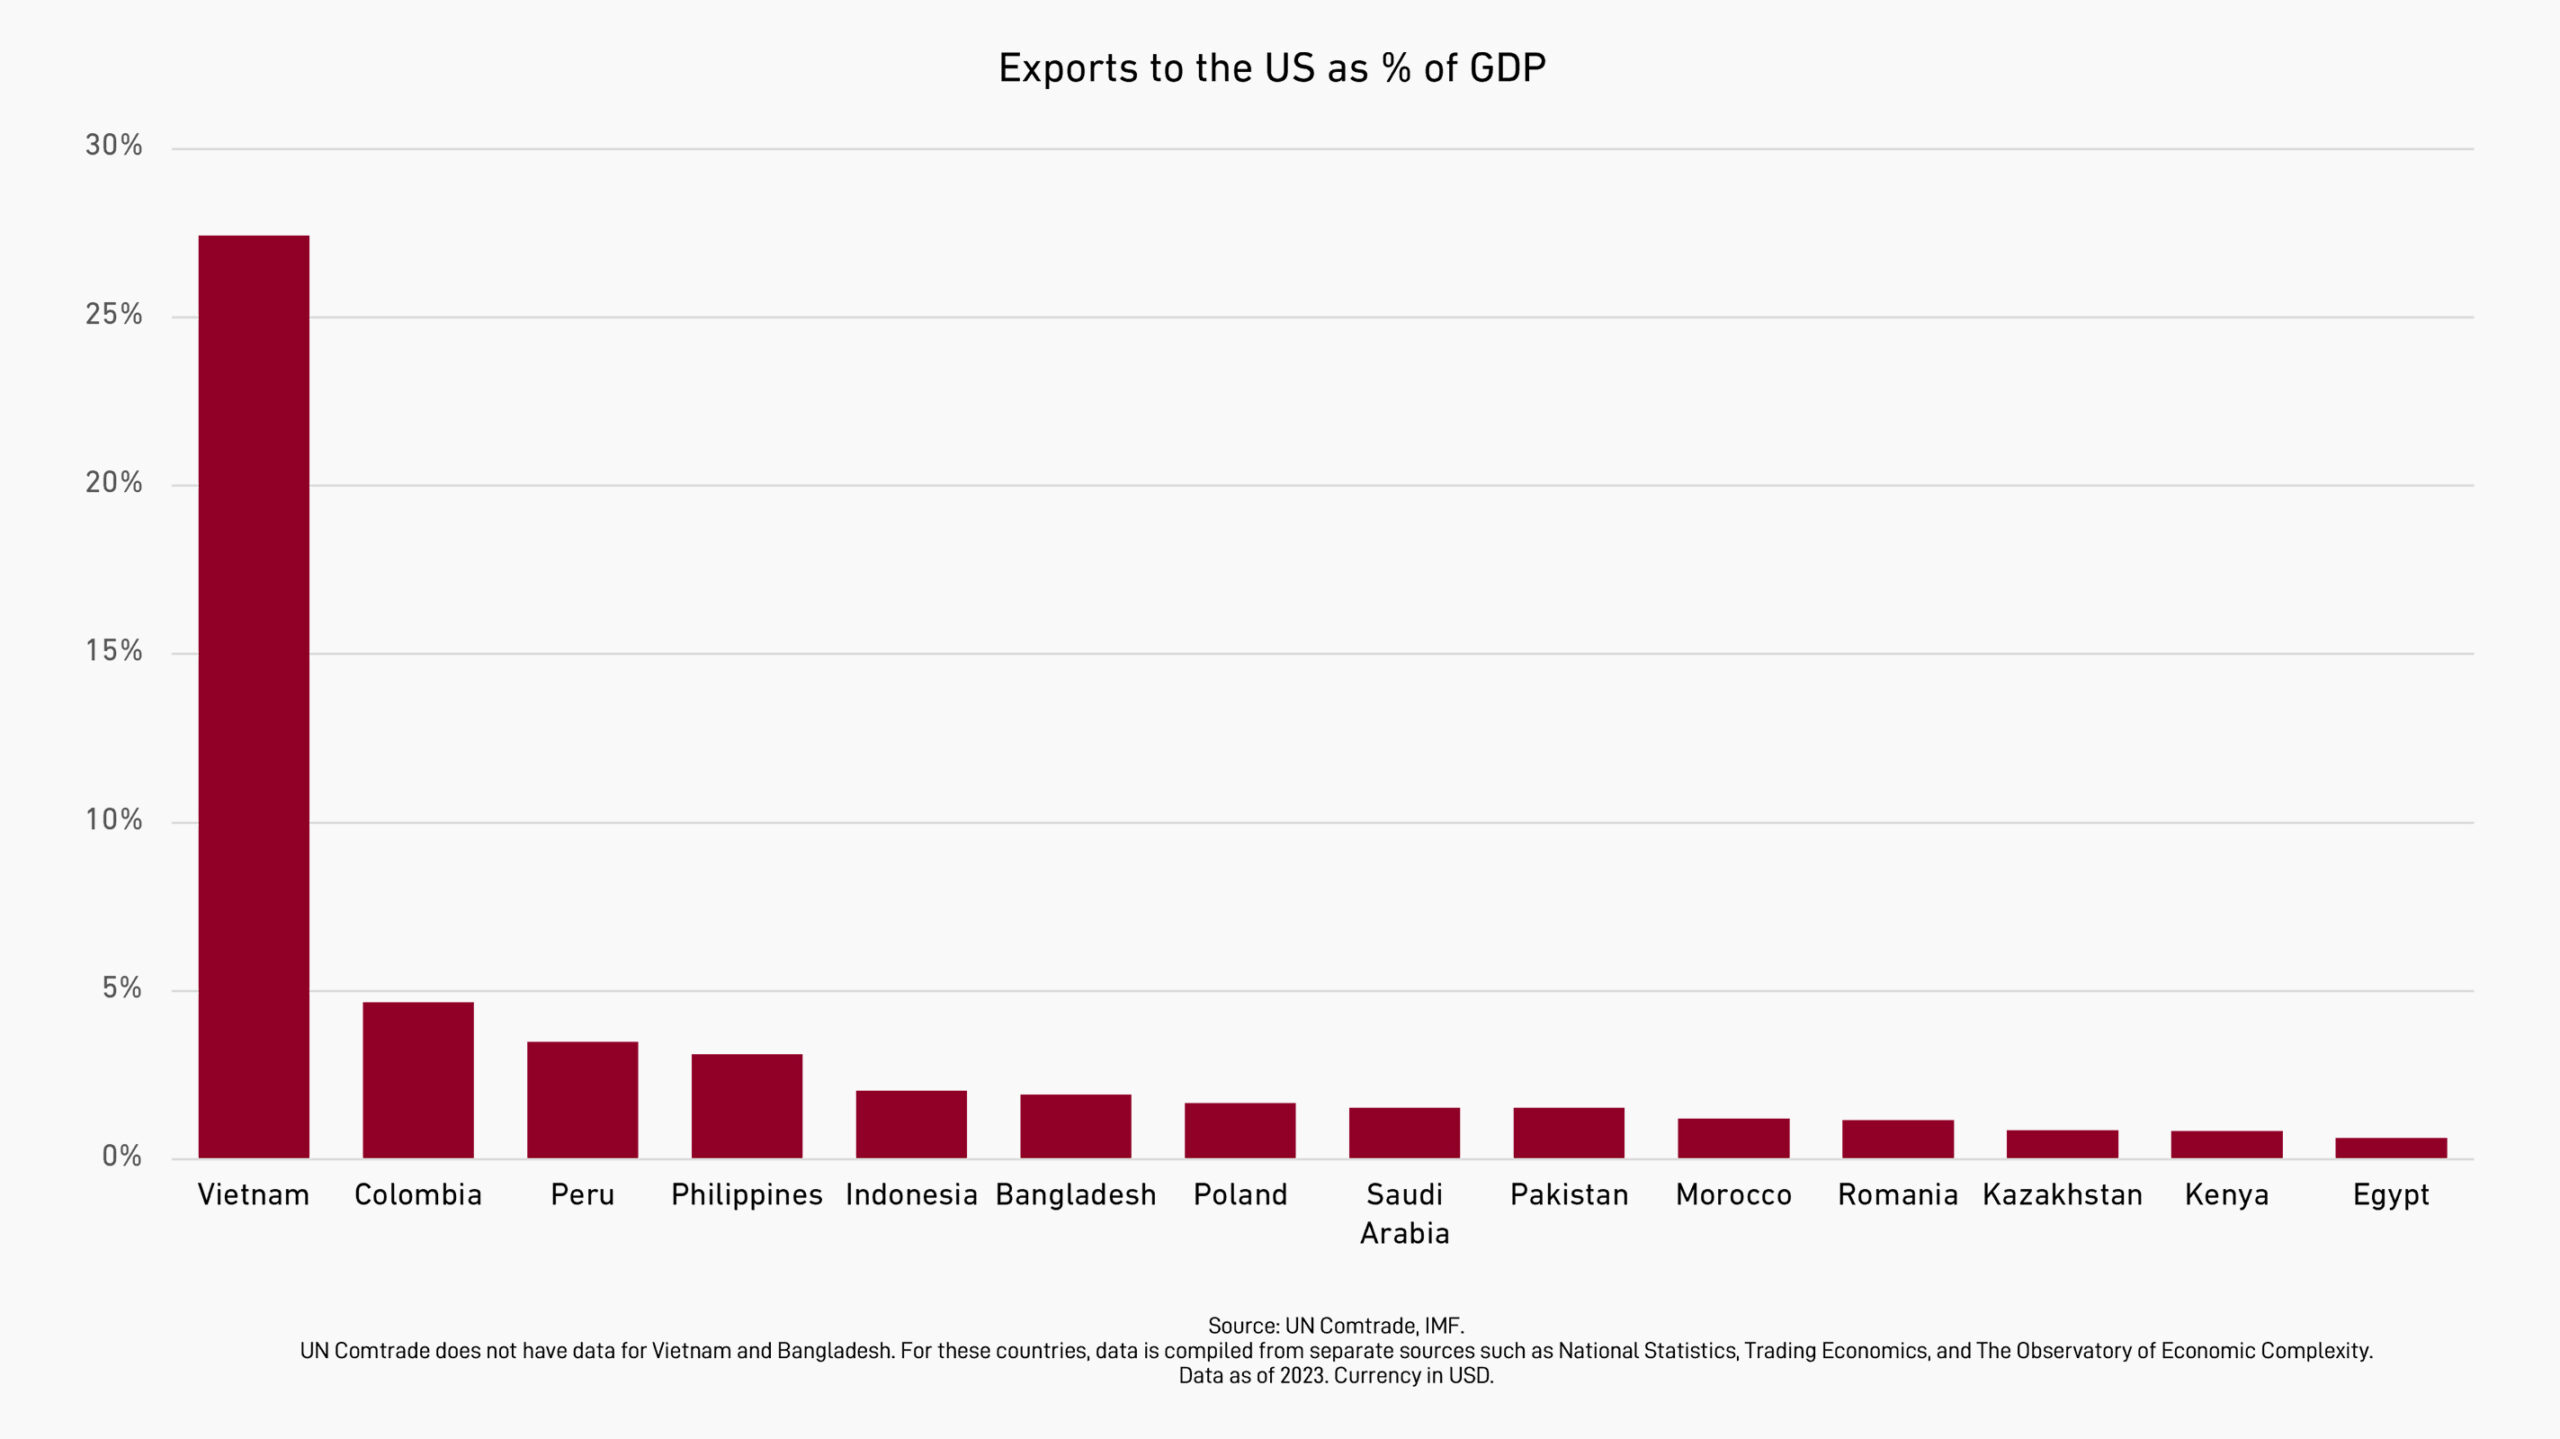
Column chart depicting frontier emerging markets countries' exports to the US as a percentage of their GDP: Vietnam (27%), Colombia (5%), Peru (3%), Philippines (3%), Indonesia (2%), Bangladesh (2%), Poland (2%), Saudi Arabia (2%), Pakistan (2%), Morocco (1%), Romania (1%), Kazakhstan (1%), Kenya (1%), Egypt (1%).

Surplus Surprise: Vietnam, Emerging Markets Top Global Trade with US

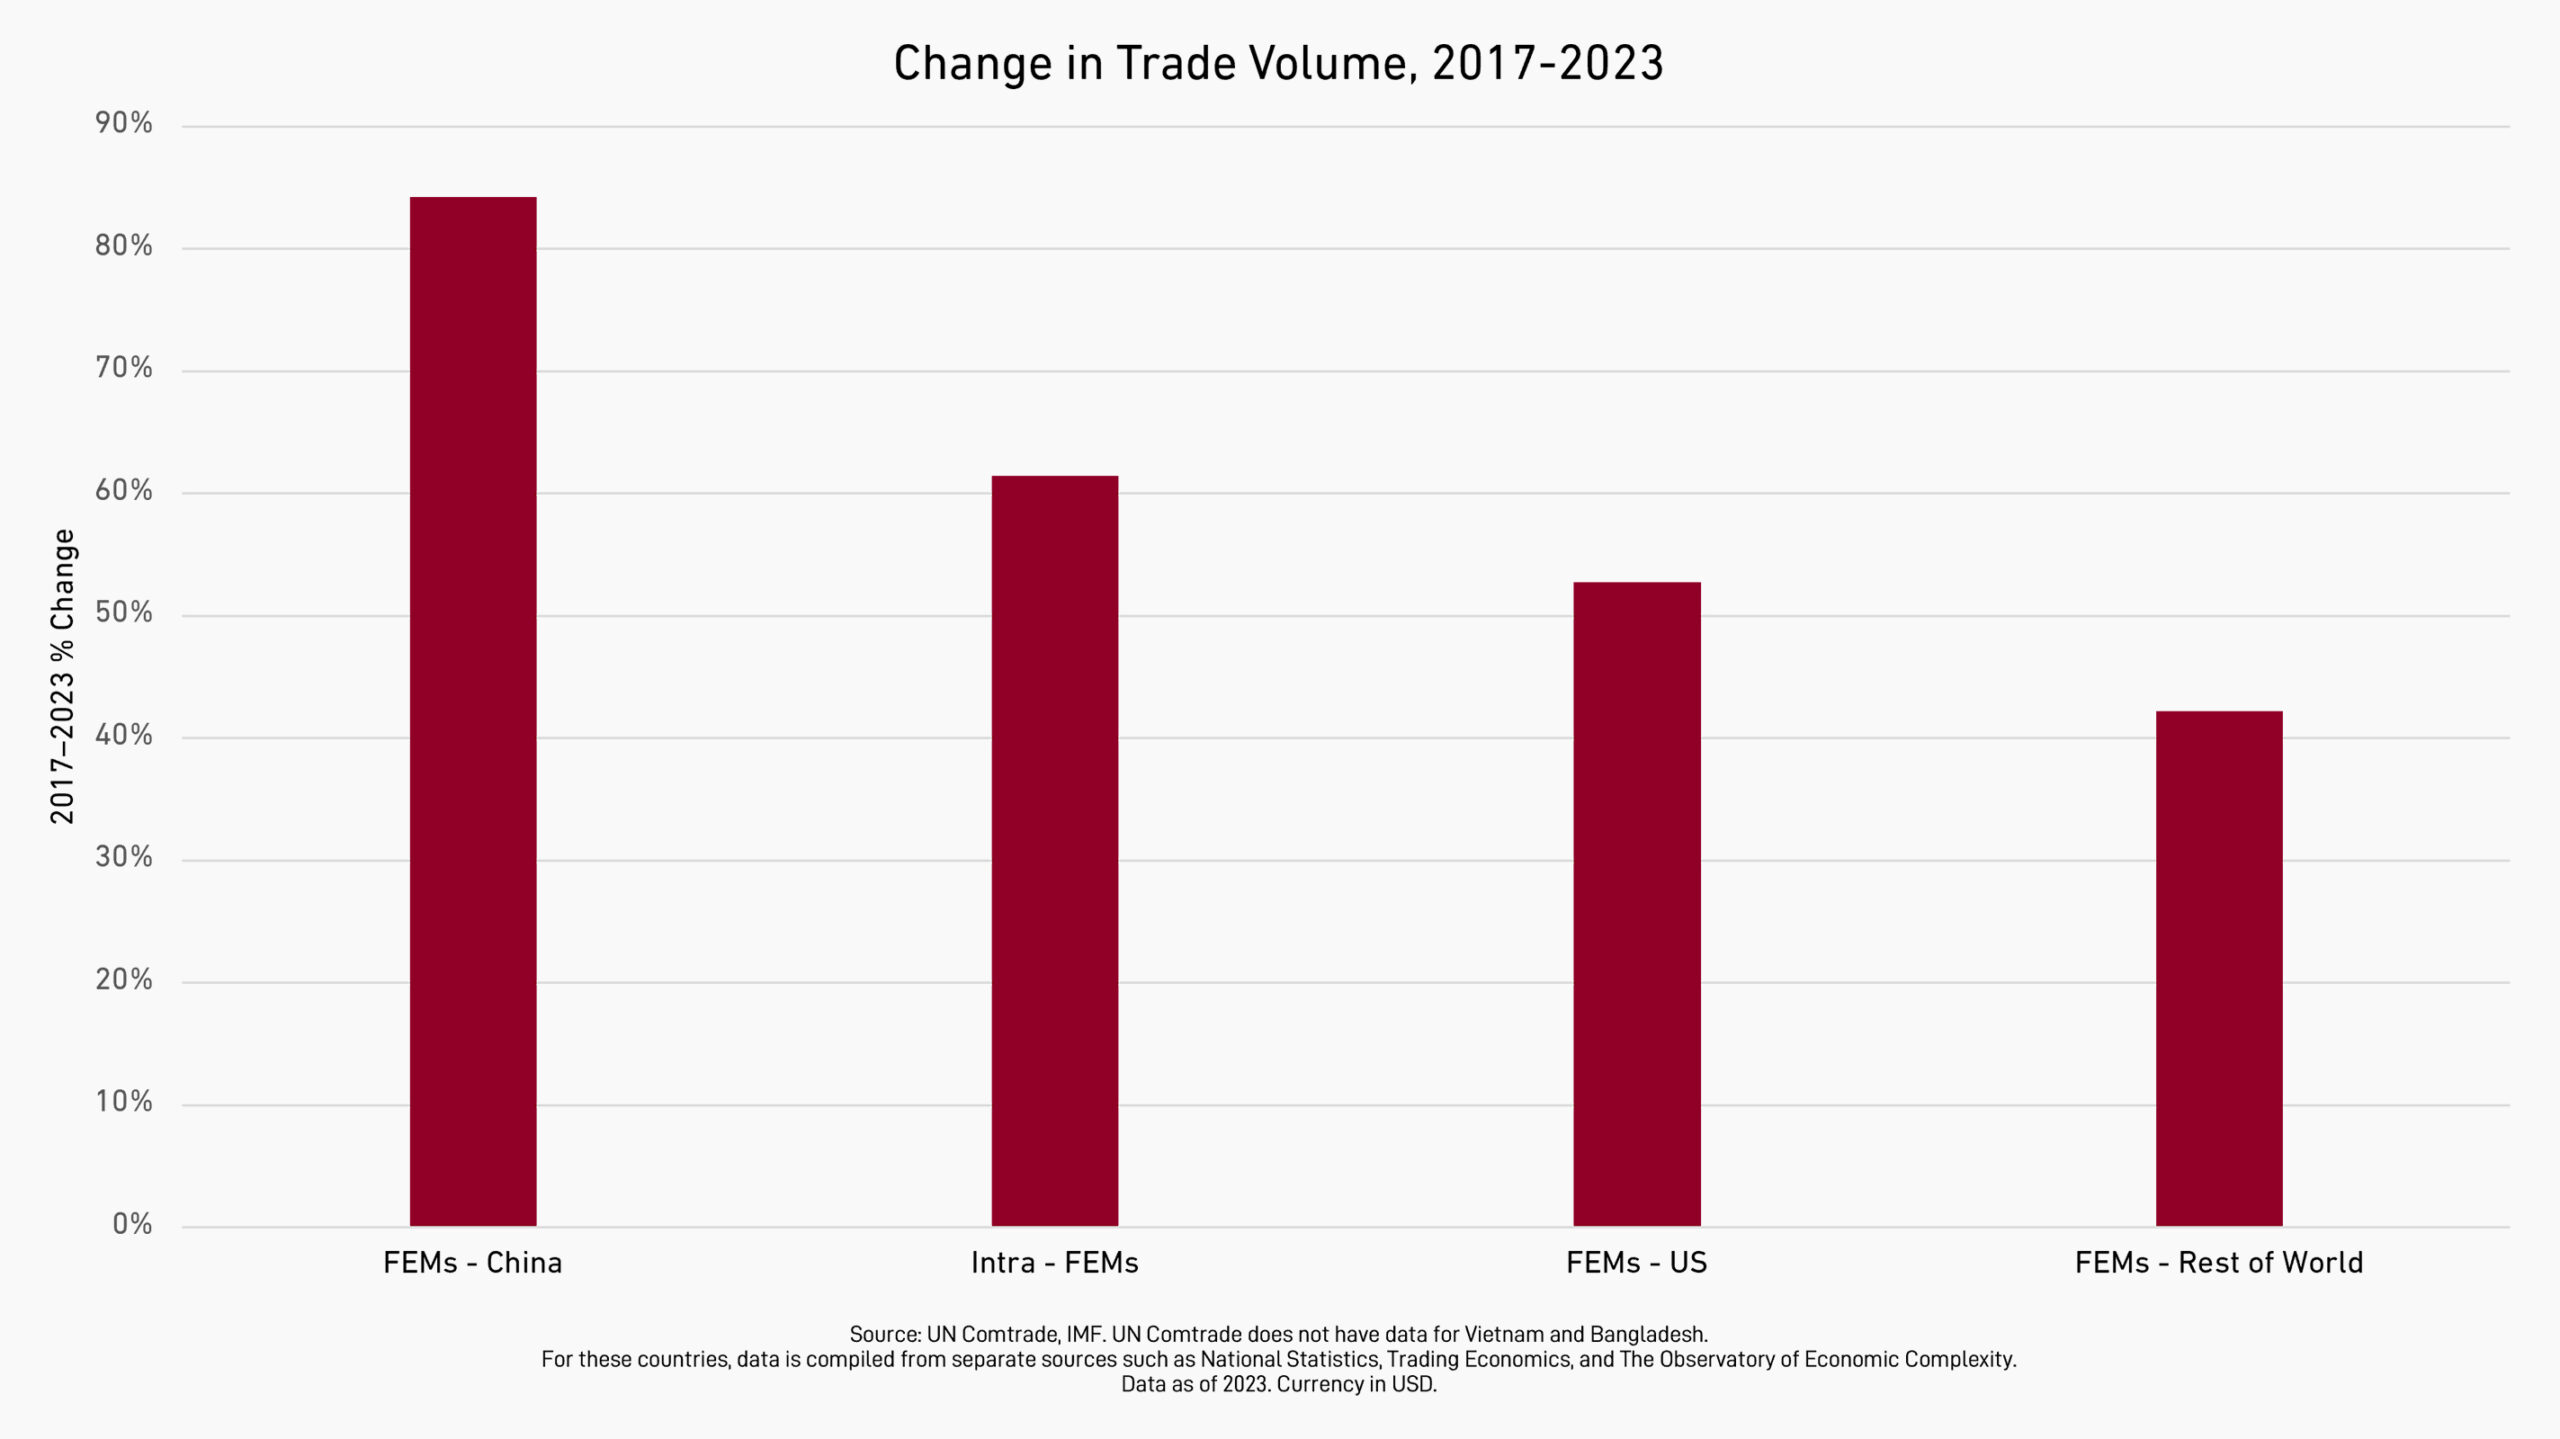
Frontier emerging markets (FEMs) fell in the fourth quarter after the election of Donald Trump in the US ushered in expectations that tariff hikes on a broad range of imports to the US will lead to inflationary pressure. Vietnam was one of the worst-performing FEMs, for good reason: the US is its largest export market. Its exports to the US account for more than 25% of its GDP, by far the largest percentage among FEMs. Exports to the US don’t account for more than 5% of the GDP in any other FEM country (though the US is the largest export market for the Philippines, which also weighed down FEMs in the fourth quarter).

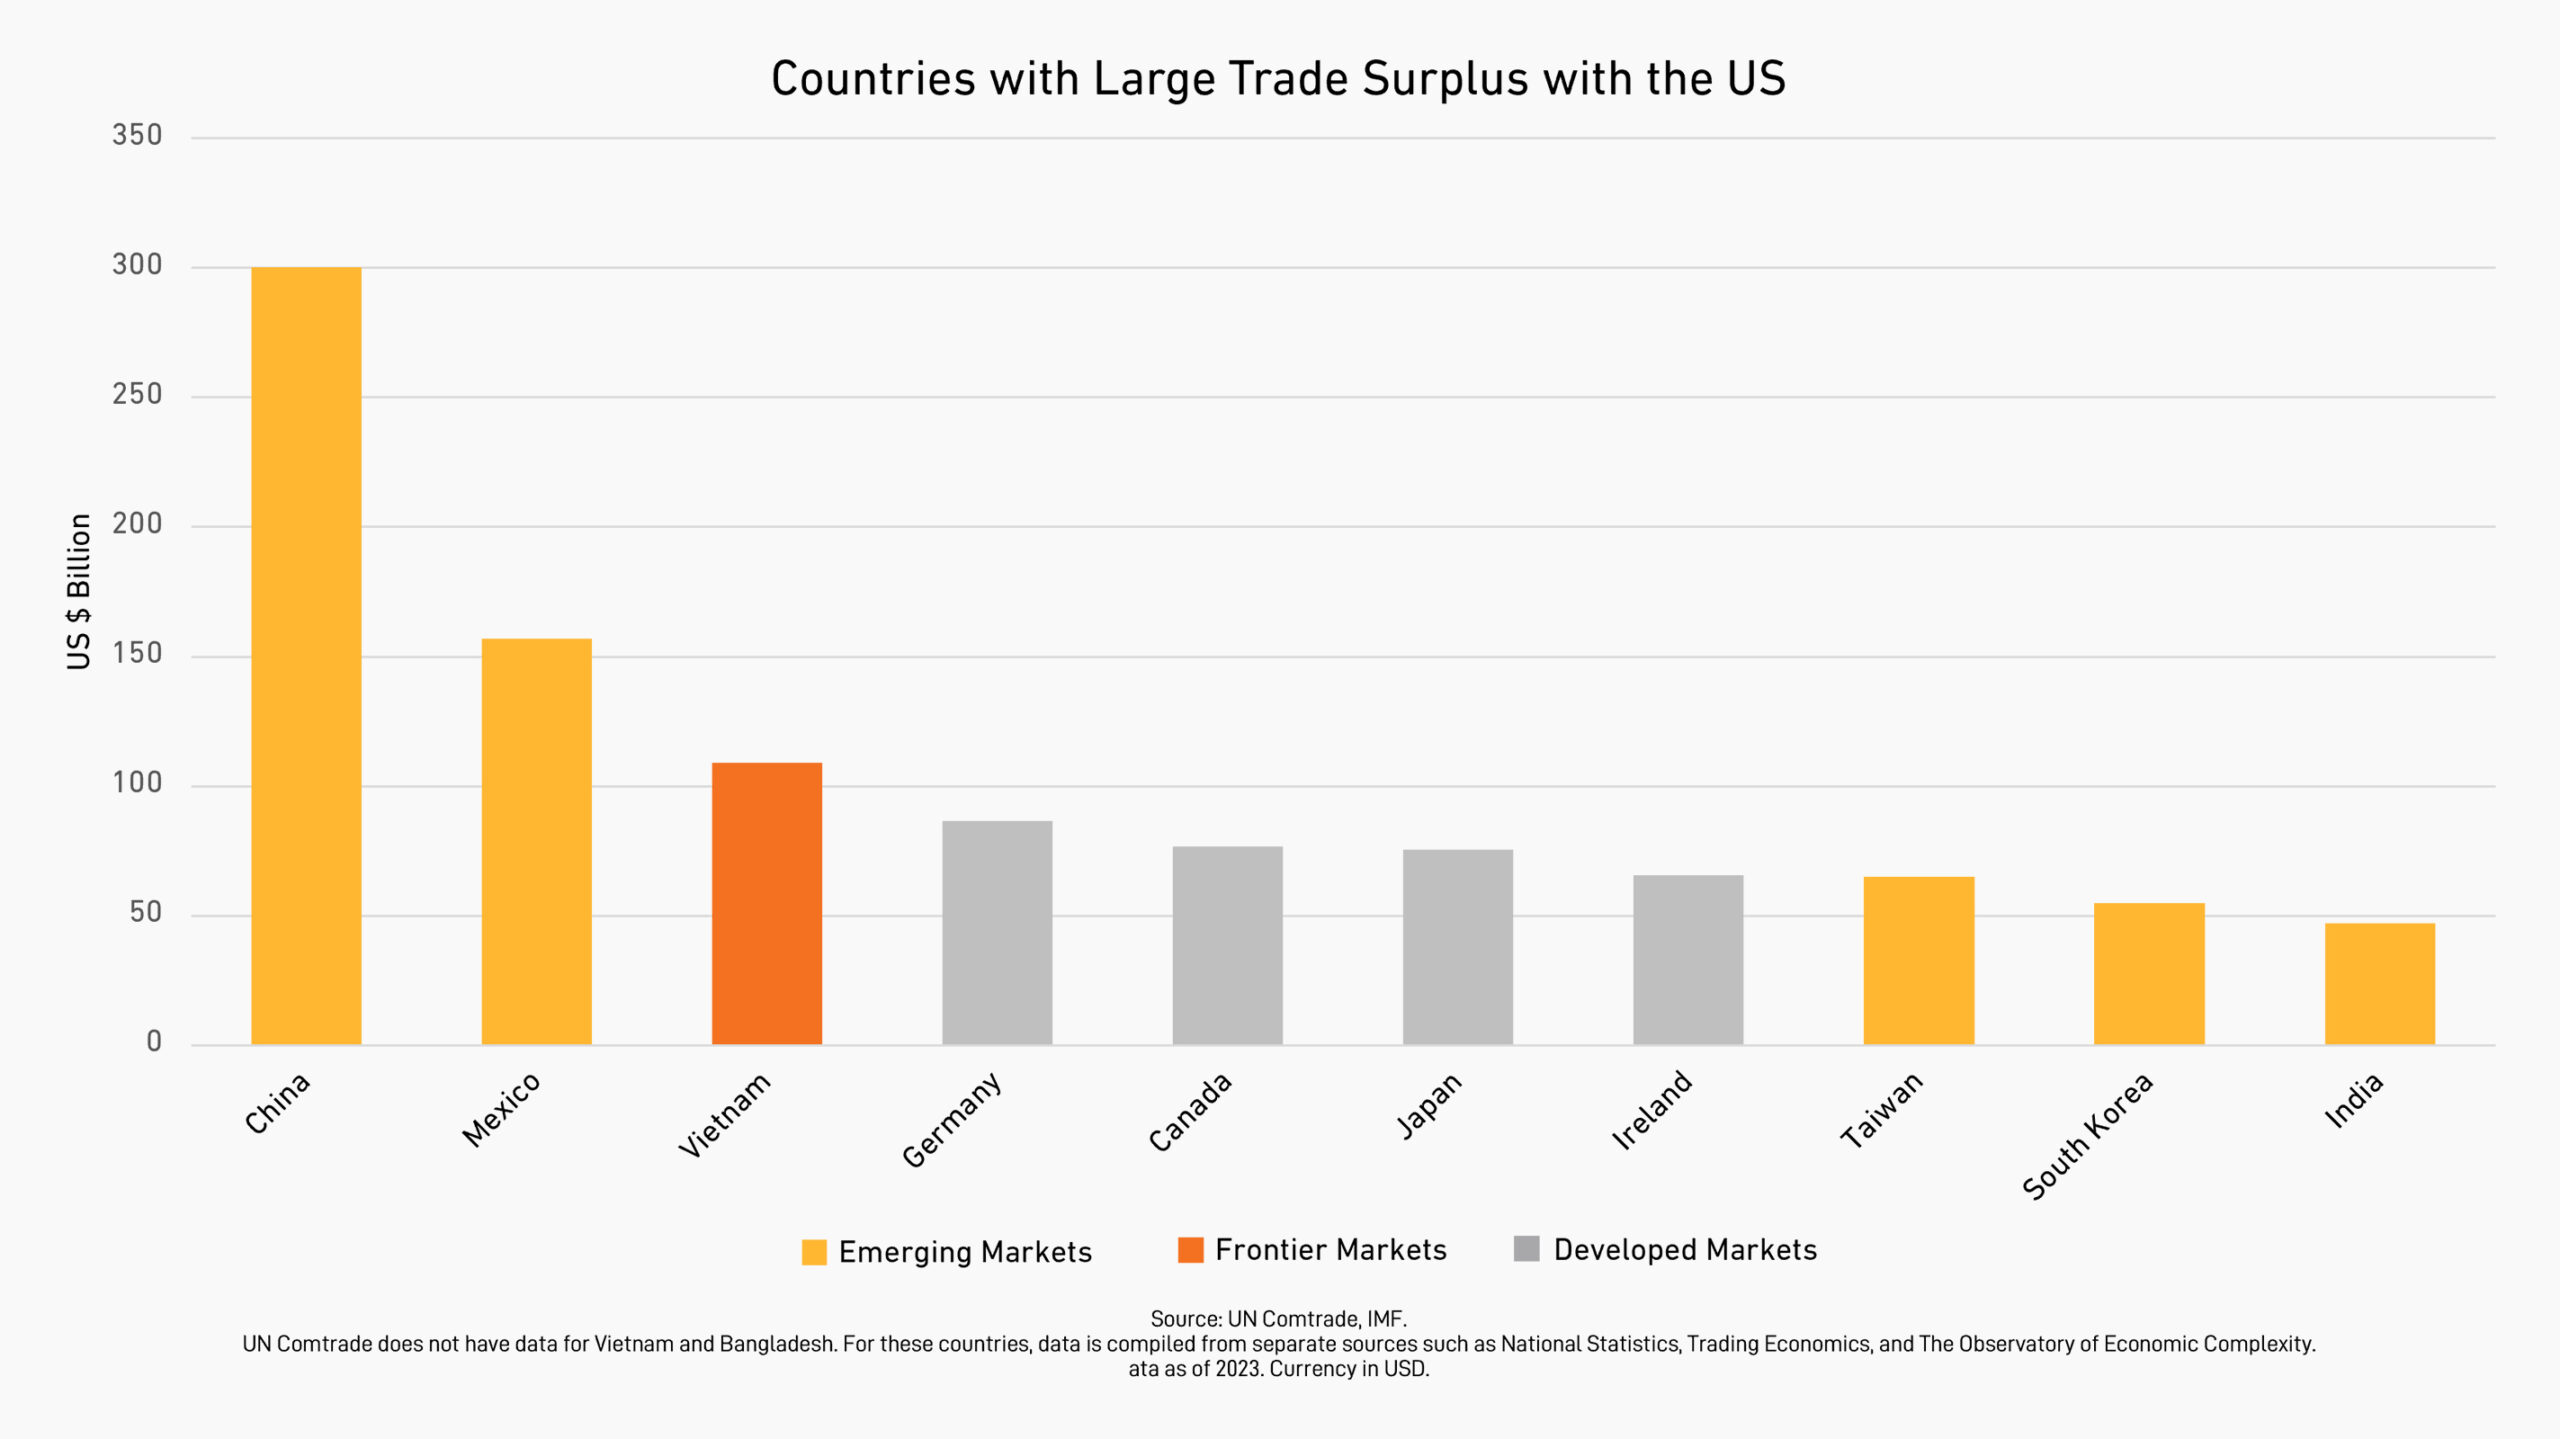
In fact, Vietnam is the only FEM that has become one of the ten largest trading partners with the US. While there are other EM countries, such as Mexico, Taiwan, and India among the top-ten US trading partners, Vietnam has grown a significant trade surplus with the US, due in part to companies rerouting shipments through the country as supply chains have adjusted over the past several years, especially in the wake of disruptions during the COVID-19 pandemic.

Bar chart showing resilience of China's and Mexico's respective currencies compared to other global currency returns in 4Q24.

Currency Depreciation: A Rational Response to Tariffs?

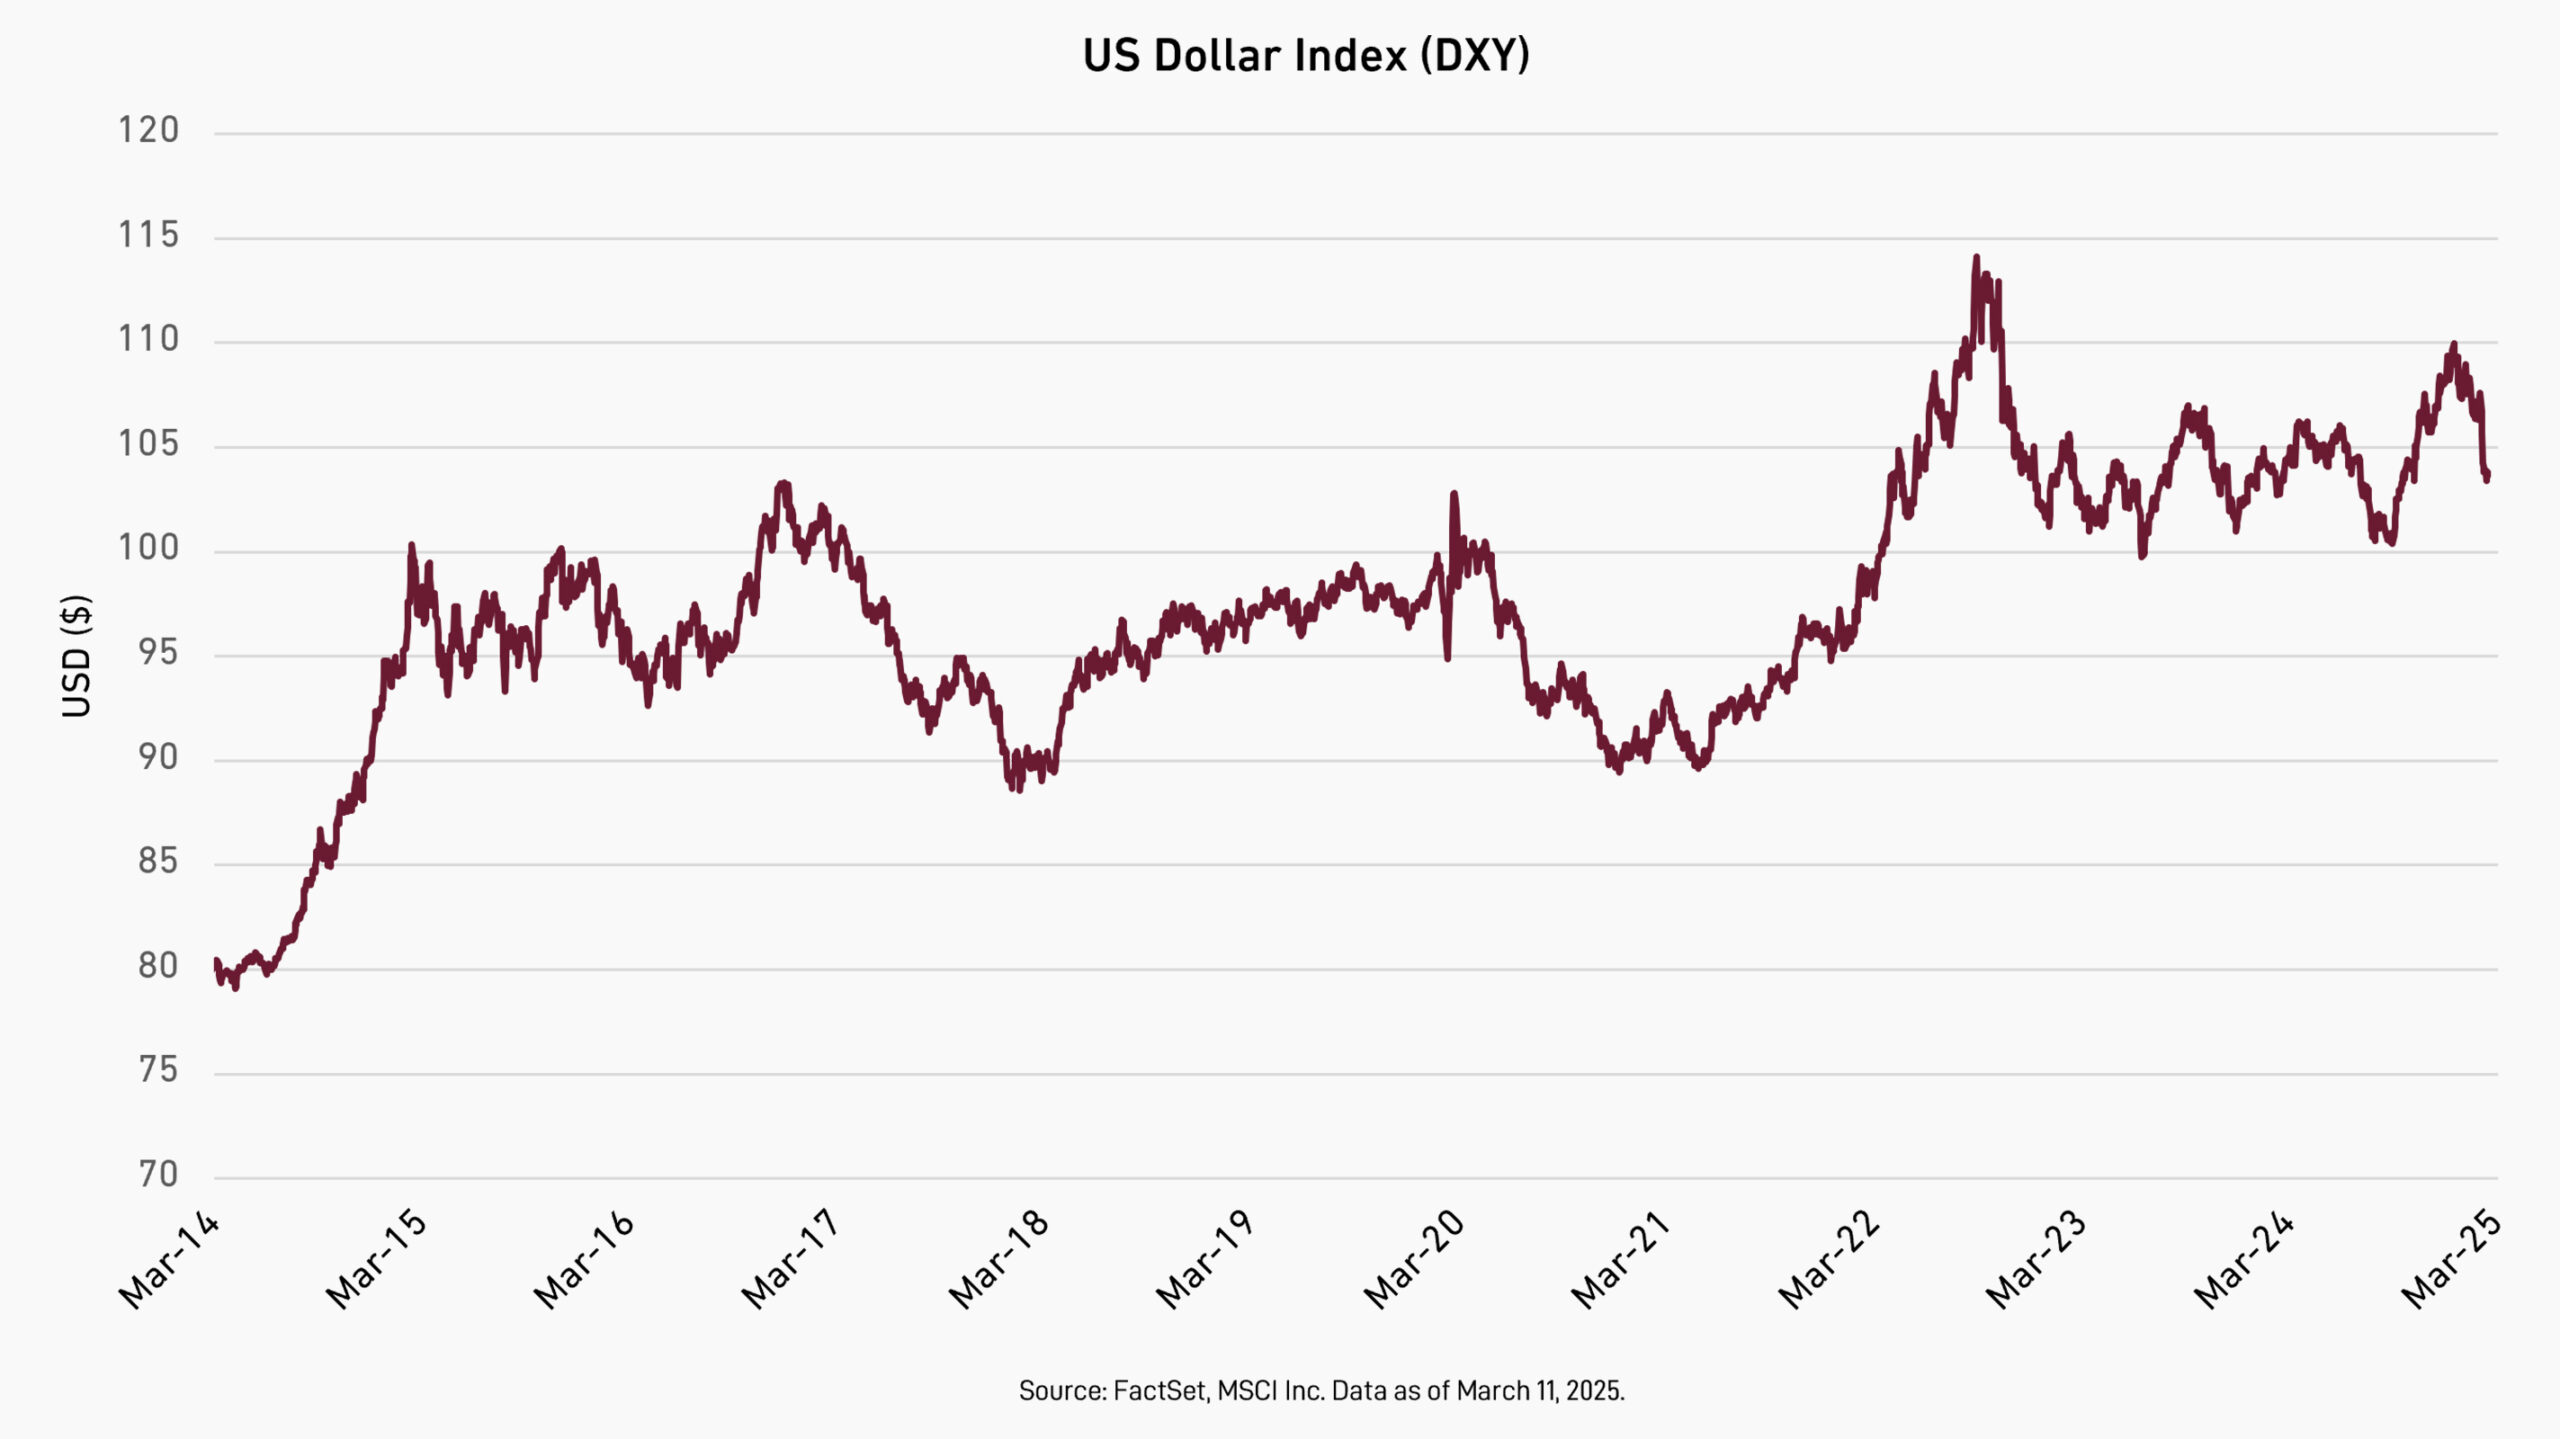
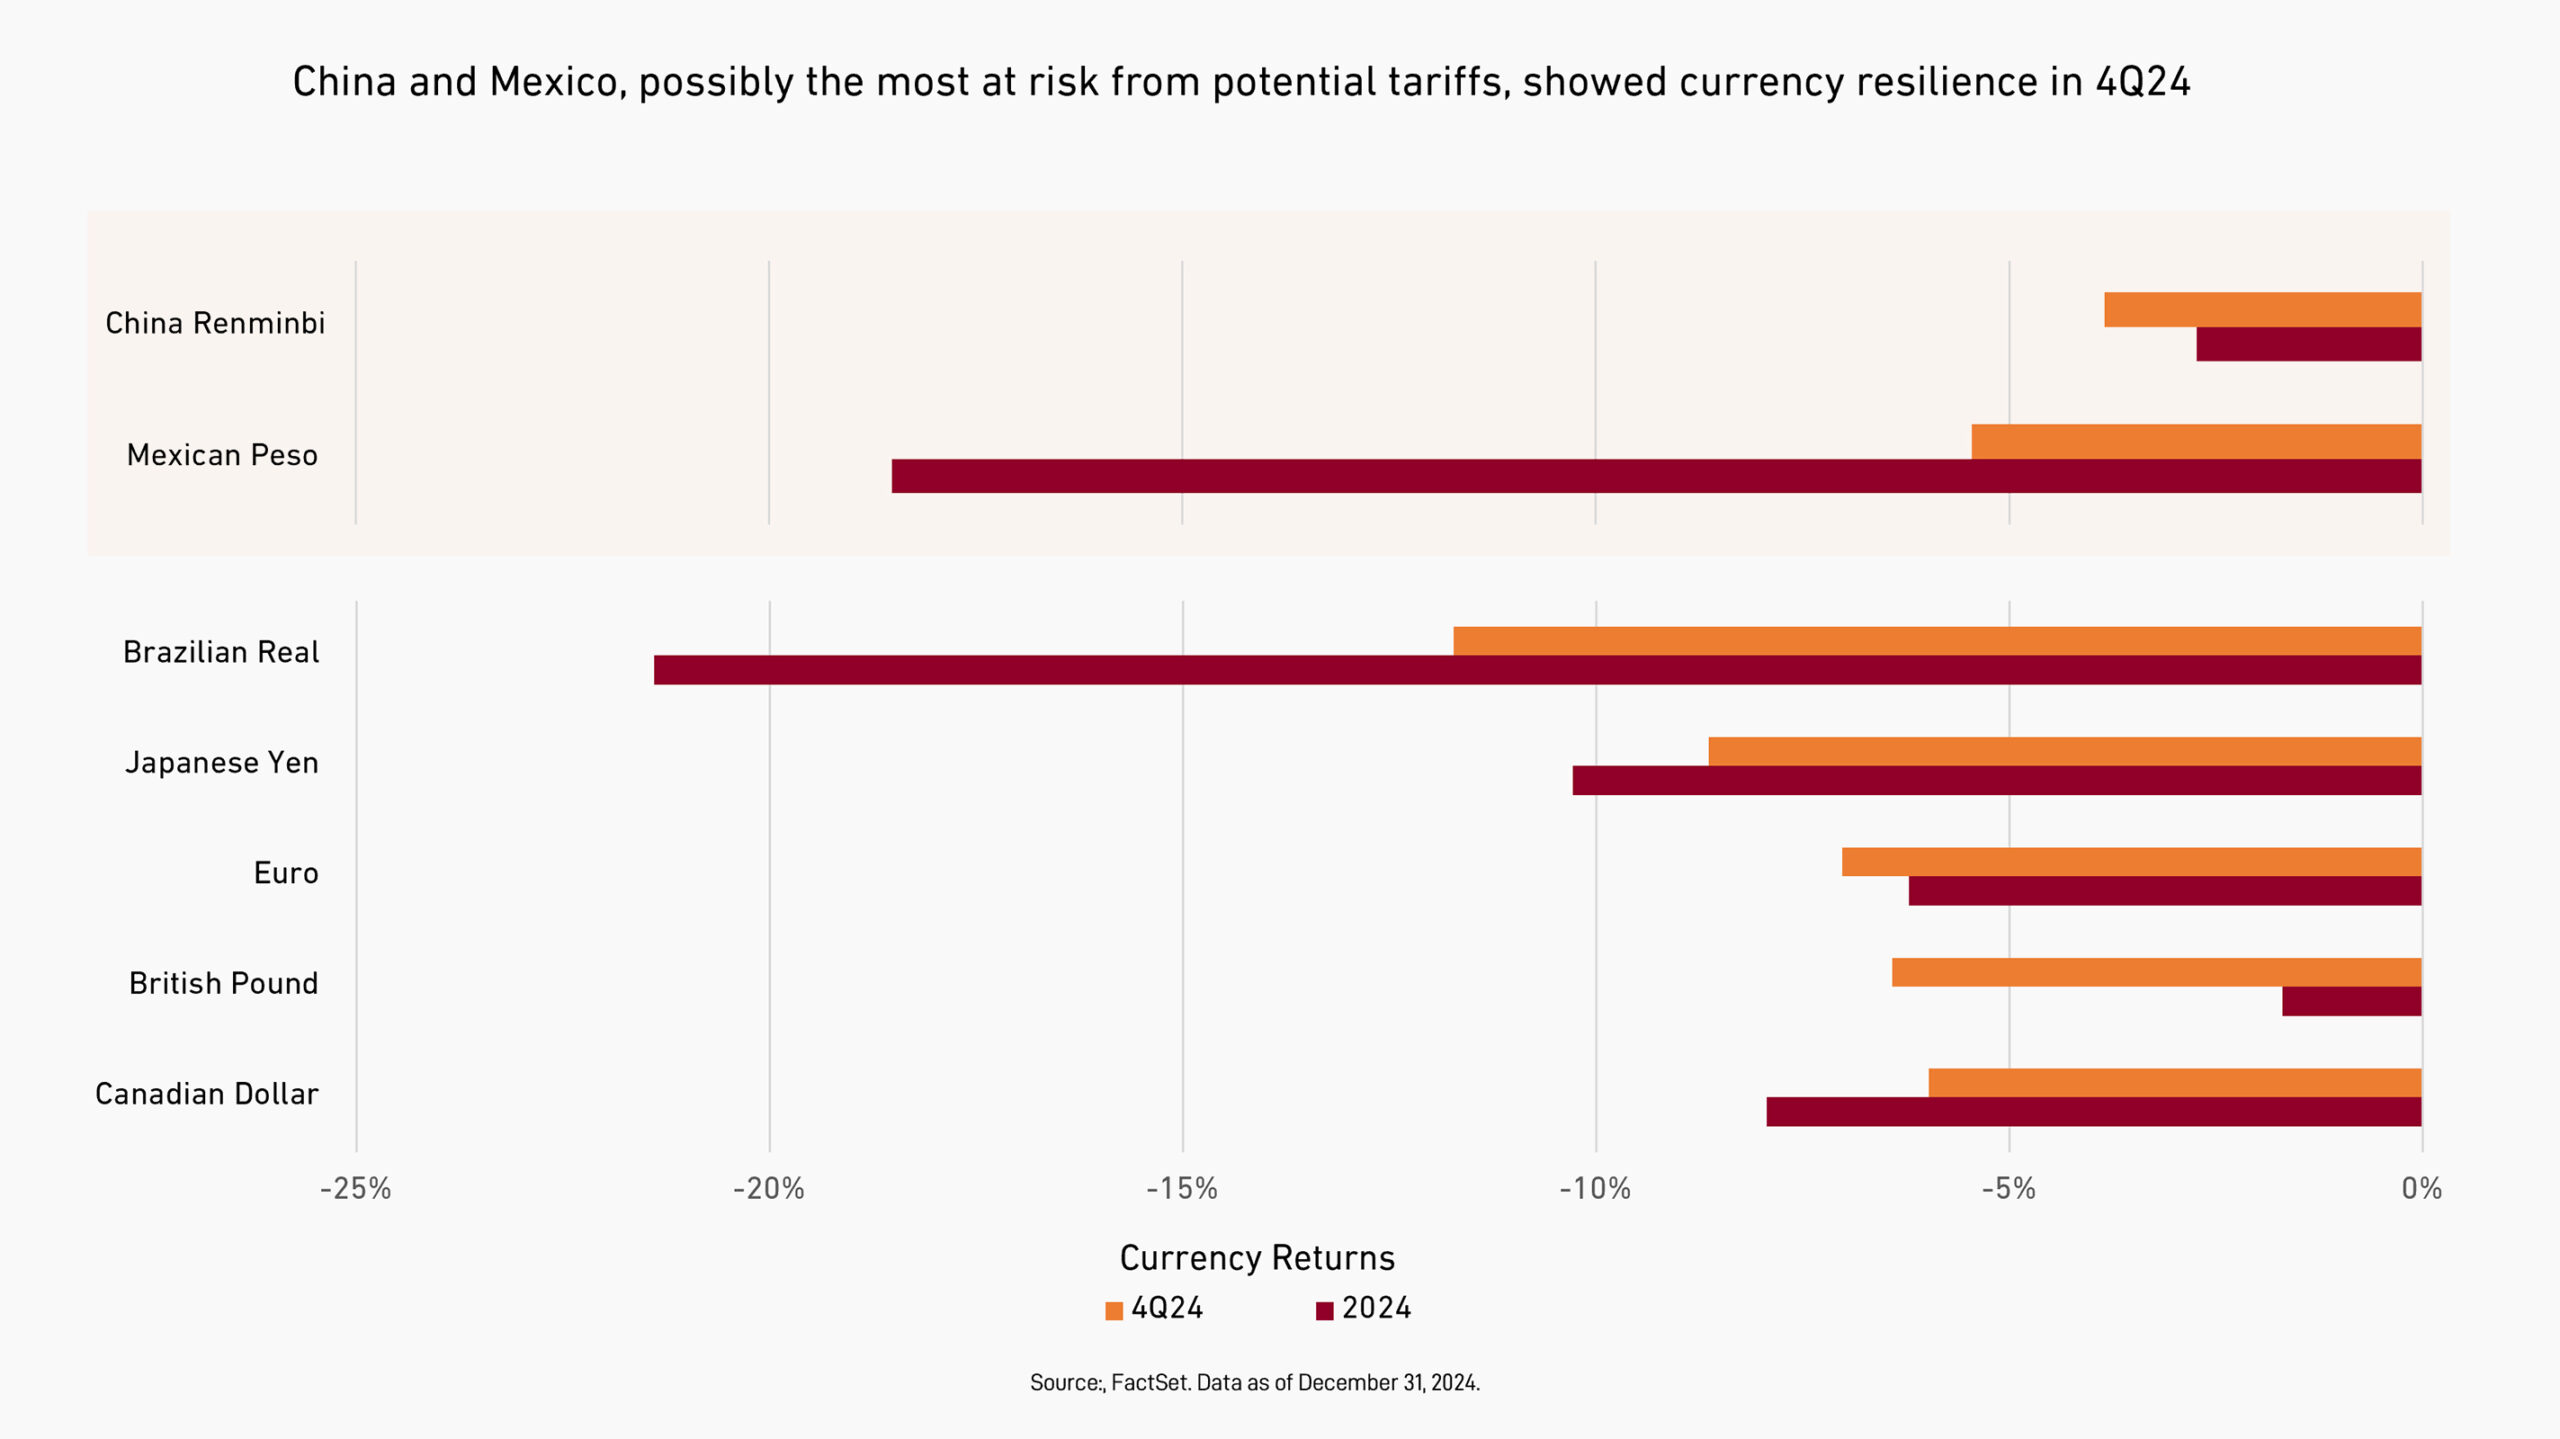
The US dollar’s rise since September cut into international markets. Of the 7% decline in international markets in the fourth quarter, the vast majority of it can be attributed to currency depreciation against the dollar.

For countries facing harsh new tariffs from the US, weakening the currency is a highly rational response: What tariffs take away in competitive pricing from other countries, currency depreciation restores with little cost to the domestic economy, keeping products competitive in the destination market. In other words, currency depreciation negates the disinflationary effects of a strong dollar as offsets to the inflationary effects of tariffs.

If a country has few other considerations (such as high foreign debts), that trade-off is fairly painless and blunts the potency of the tariffs to alter any other policy or behavior. So far that’s not what you see in this recent spate of currency depreciation: The two countries currently facing the severest threats from additional US tariffs are China and Mexico, but neither of those currencies exhibited much weakness during the fourth quarter as seen in the above chart. However, in the longer term, we think currency depreciation may not be such a bad thing for the US’s trading partners.

Stylized graphic of a world map.

Why Own International Stocks?

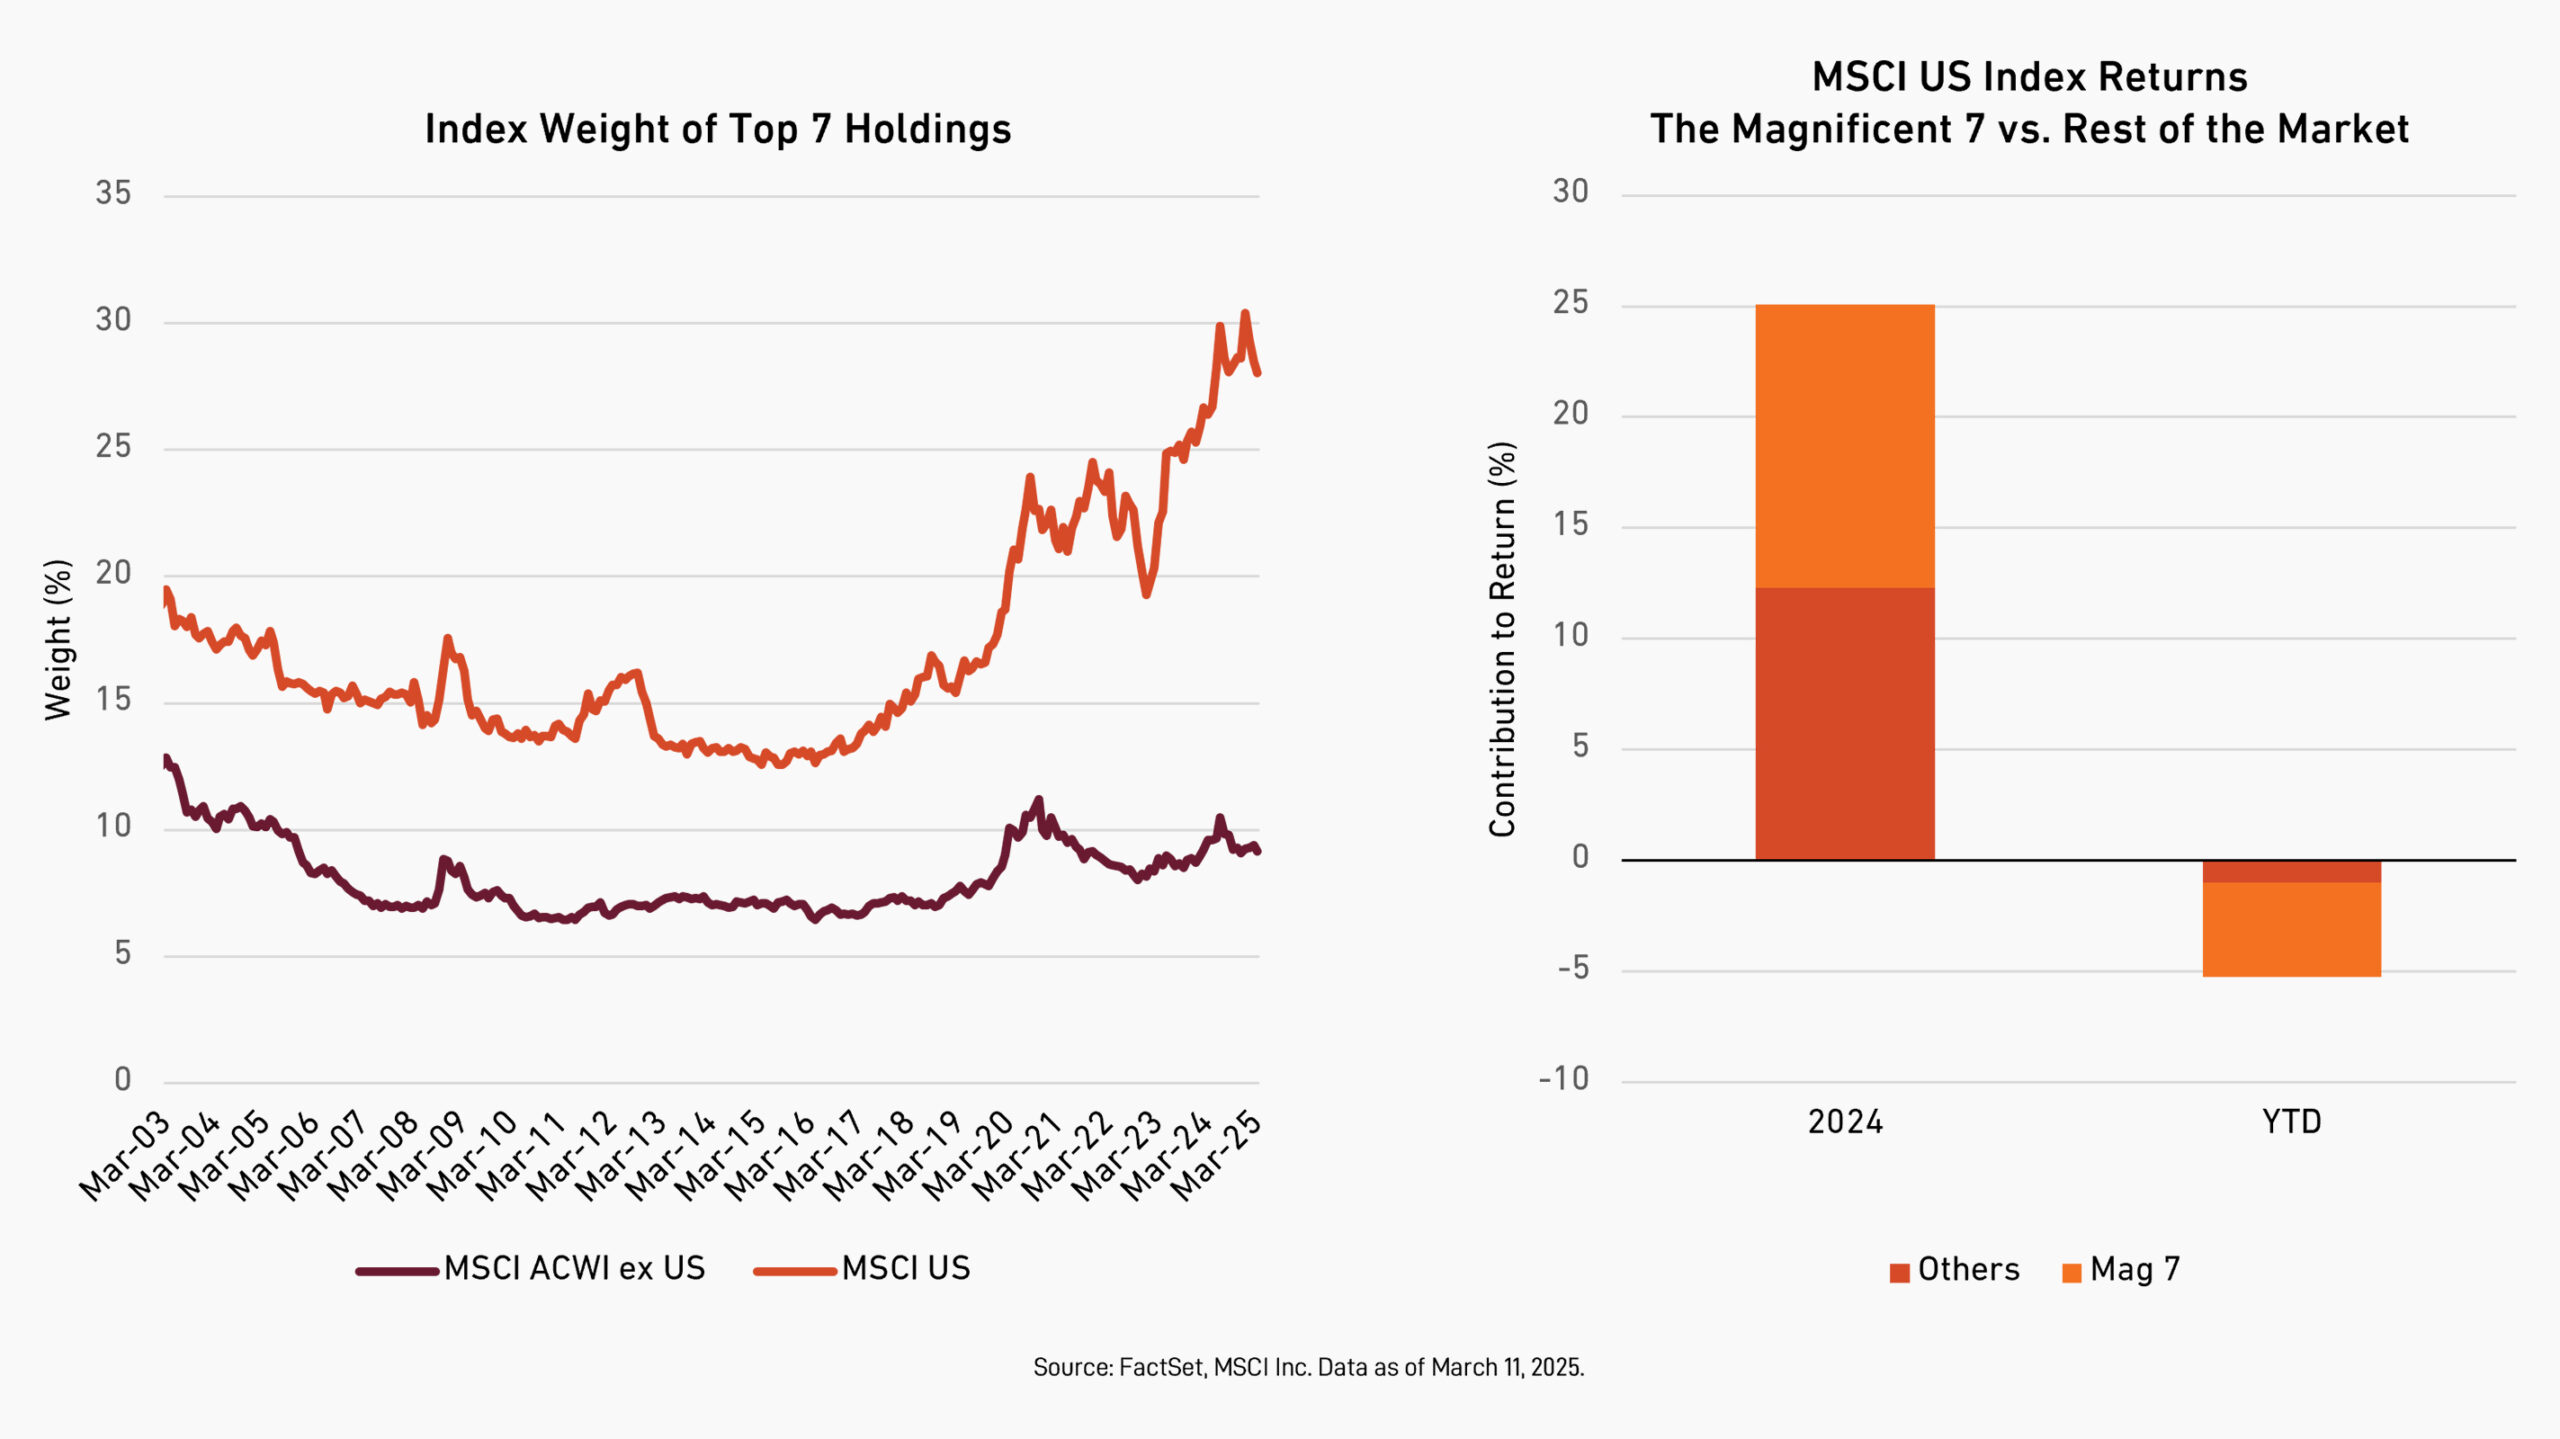
For more than a decade, equity returns in international markets have trailed those of the US. There are various possible explanations, but a central one is that the US, after first staging a faster recovery from the global financial crisis, has tended to produce stronger earnings growth in the years since. Meanwhile, from an international perspective, everything from a strong dollar to geopolitical conflict to volatility in emerging markets to China’s economic slowdown have weighed on relative returns. It also doesn’t help that the arrival of ChatGPT, and the enthusiasm and competition it has inspired for generative artificial intelligence technology, has lately encouraged an almost singular focus on a handful of US tech stocks—out of nearly 2700 index constituents, a mere 0.2% of the companies in the MSCI ACWI Index.

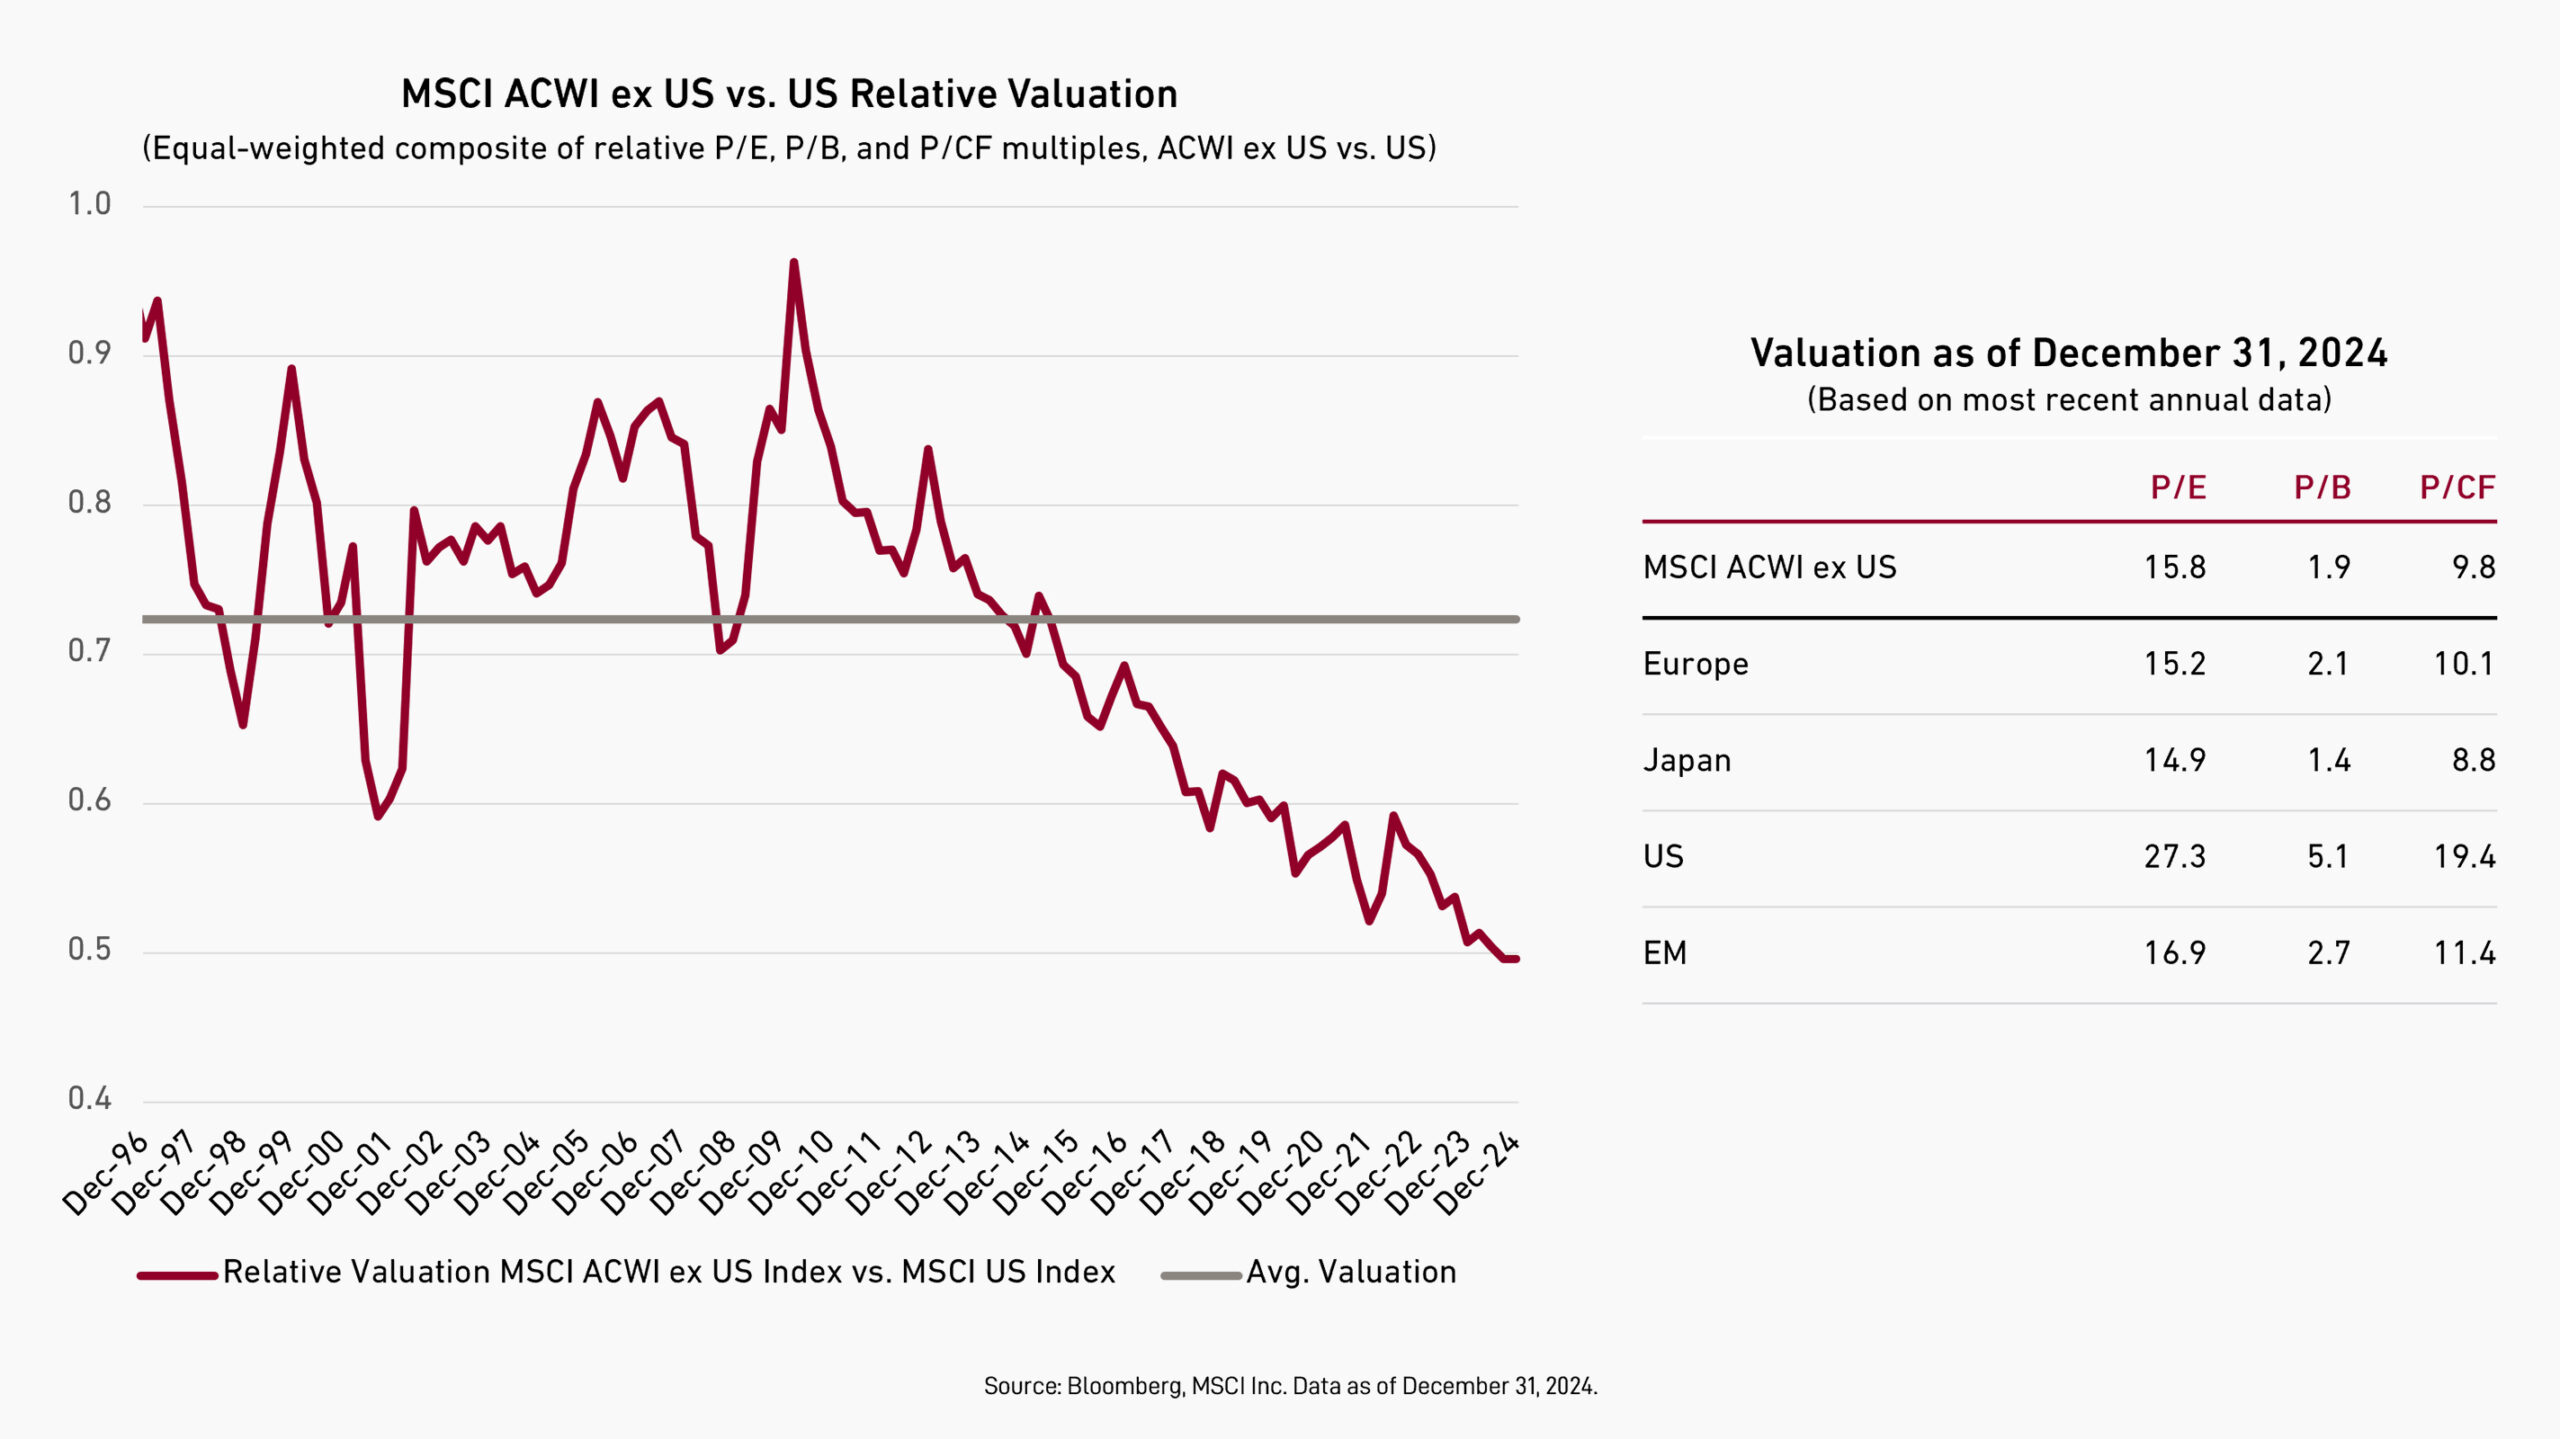
Some investors look at the difference between international and US returns and, expecting that current conditions will persist, wonder what place non-US equities have in a portfolio today. But while it’s easy to fall into that line of thinking, history suggests it is likely wrong. The relative performance of US and non-US stocks has historically been a cyclical phenomenon, and as the chart below shows, their indexes have regularly swapped between leader and laggard over the past 50 years.

Bar chart comparing the top five countries’ weightings in the MSCI Frontier Markets Index vs the MSCI Emerging Markets Index.

Frontier Markets Require an Active Look

At Harding Loevner, we focus on building portfolios from the bottom up, guided by our quality-growth philosophy, and rarely comment on actions of other investors or index providers. But sometimes it’s necessary to do so to highlight meaningful developments affecting the frontier emerging markets (FEM) asset class.

In June, asset manager BlackRock announced its intention to liquidate its Frontier & Select EM ETF, which once had assets exceeding US$400 million. The company cited currency liquidity challenges in several smaller frontier markets as the main reason for its decision.

BlackRock’s decision to close its passive FEM fund underscores our long-held belief that the idiosyncratic nature of frontier and small emerging markets, as well as their volatility and liquidity characteristics, make them much better suited for an active rather than passive investment strategy.

Red and orange abstract graphic.

Our 2023 Letter to Shareholders

Three years since the first COVID-19 vaccine was approved, growth investors have felt the pain of a relative bear market compared to their value peers. In our annual letter to shareholders, we examine the current economic climate, and discuss why we believe that the types of companies in which we invest are well-positioned to navigate the challenges ahead.

In sum, this time is no different from similar periods in the past in which our taste for high-quality, rapidly growing companies has been out of step with market fashion. We foresee an eventual return of investor focus on such fundamental factors in the face of uncertain and slower economic and corporate profit growth. We therefore remain committed to our favored targets, while reinforcing our attention to the price we are asked to pay for them.

Investments involve risk and loss is possible.

The Portfolio’s investment objectives, risks, charges and expenses must be read and considered carefully before investing. The statutory and summary prospectuses contain this and other important information about the investment company. They may be obtained by calling toll free (877) 435-8105, or visiting hardingloevnerfunds.com.

The Portfolio is distributed by Quasar Distributors, LLC.

Abstract red and orange graphic.

Why Own International Companies?

When US stocks have outperformed for as long as they have—creating the world’s first trillion-dollar companies in the process—it’s easy to forget that plenty of highly profitable businesses exist a long way from Silicon Valley or Seattle.

While US companies account for just over 60% of the market capitalization of the MSCI All Country World Index, their weight is a tad misleading given that a few technology giants—Alphabet, Amazon, Apple, and Microsoft—weigh heavily on the scale. Together, those four are valued at nearly US$8 trillion, more than the next 15 largest US stocks combined.

Stylized portrait of Edmund Bellord, Analyst and Portfolio Manager at Harding Loevner.

Beauty and the Beast

The rise in passive investing is undoubtedly among the most important developments in asset management. The mass adoption of cheap, easily accessible portfolio building blocks that mimic the performance of market capitalization-weighted indices is nothing short of a paradigm shift. Indexed assets now account for over 50% of US domestic equity funds, 40% of global funds, and, despite a later start, already constitute 30% of fixed income fund assets.1 The shift is ongoing and it’s far from clear where the upper bound, if any, might lie.

Much of the debate surrounding indexing centers on the relative merits of taking an active versus passive investment approach. But the question of how indexing might be reshaping market structure is largely unexplored. The standing assumption is that, since passive investment flows mirror the prevailing distribution of capital, index trades are bereft of information and therefore have no effect on the pricing of the underlying securities; hence the overall scale of indexing is irrelevant. But this assumption becomes more tenuous as the share of passively managed assets grows. What if passive increased to, say, 100% of all equity assets? Would those investments still have no effect on prices?

It’s unclear how the widespread use of indexing may be affecting market structure; that is, at what point the sheer quantity of assets mimicking market behavior could start to change the behavior. Maybe it already has.

Receive our investment updates in your inbox.
Quarterly Commentaries
Monthly Reports
Quarterly Webcast Schedule
Insights from our Investment Team
Company HLHP
Opt-In Confirmation*
 

*By checking “Opt-In Confirmation,” you consent to receive investment updates from Harding Loevner. You can withdraw your consent at any time. Contact us.

Disclosures

“Out of Our Minds” presents the individual viewpoints of members of Harding Loevner on a range of investment topics. For more detailed information regarding particular investment strategies, please visit our website, www.hardingloevner.com. Any views expressed by employees of Harding Loevner are solely their own.

The information provided is as of the publication date and may be subject to change. Harding Loevner may currently hold or has previously held positions in the securities referenced, but there is no guarantee that Harding Loevner currently owns, or has ever owned, the securities mentioned herein. If Harding Loevner owns any of these securities, it may sell them at any time.

Any discussion of specific securities is not a recommendation to purchase or sell a particular security. Non-performance based criteria have been used to select the securities discussed. It should not be assumed that investment in the securities discussed has been or will be profitable. To request a complete list of holdings for the past year, please contact Harding Loevner.

There is no guarantee that any investment strategy will meet its objective. Past performance does not guarantee future results.

© 2025 Harding Loevner