For almost half a century, a niche within empirical finance has dedicated itself to sifting through accounting data in search of company traits that influence stock prices. Despite the plethora of factors unearthed, figuring out the precise drivers behind their behavior is still a bit of a mystery. For investors, simply identifying a factor isn’t enough; you also need to understand who’s on the other side of the trade—and why. Otherwise, who’s to say if a historical pattern will repeat in the future.
The difficulty in pinning down exactly what’s behind such canonical factors as quality, value, and momentum shouldn’t be a surprise. Factors can only be observed after the fact, but the underlying mechanisms that produce them are hidden. They are birthed from the complex interplay of buying and selling against a backdrop of economic and geopolitical shifts, all woven together by intricate feedback loops. Because they emerge as properties of a complex system, and because their returns wax and wane over decades, pinpointing a definitive root cause is quite the challenge.
Among factors, perhaps the biggest puzzle, however, is what lies behind the excess returns that have accrued to companies with strong balance sheets, consistent profitability, and operational excellence, typically referred to as the quality factor. Investors should be willing to pay up for such enviable characteristics, and they do, but not as much as they should and therein lies the puzzle. Narratives about risk can shed light on the performance of value stocks, and the idea of slow-spreading information can account for momentum, but what exactly is behind the outperformance of high-quality stocks remains elusive.
For behavioralists, often mistakenly criticized as viewing every market inefficiency as proof of human imperfection, the quality factor is a reflection of rational, yet imperfect, heuristics that sometimes lead to less-than-optimal outcomes. For strictly orthodox economists who hold fast to the notion of a perfectly rational human agent, every excess return must be a manifestation of some as yet unrecognized risk. And a more unconventional viewpoint turns the traditional understanding of the quality factor on its head, suggesting instead that what we’re observing is not a premium for high quality so much as discount applied to everything else.
A Question of Behavior
An argument that resonates with us, given our interest in decision-making, is that the quality premium is a strange brew that is cooked up in a cauldron of behavioral biases.
One such bias is our species’ attraction to novelty which isn’t just a quirk, but a survival mechanism with deep evolutionary roots, aiding in resource discovery, adaptation, learning, and fostering genetic diversity. However, in the realm of investing, this penchant for the new and thrilling—such as groundbreaking companies or industries believed to hold unparalleled growth potential—can be a double-edged sword. While novelty propels us toward innovation, it may also detract from investment performance as the inclination towards novelty can distract us from well-established, dependable companies, causing these reliable (but perhaps less flashy) businesses to trade at undemanding valuations.
Investing in the latest hot stocks or jumping on board the next big thing also comes with perks that aren’t just about money. Being able to dazzle friends and colleagues with tales of daring portfolio moves might not do much for your bank balance but may well boost your social standing. A desire for non-financial psychic returns, a feature of gambling and other negative expected value pastimes, can prompt investors to pursue the latest speculative ventures over more reliable, high-quality firms, even though the latter may offer superior financial gains in the long run.
Overconfidence and the illusion of knowledge are additional behavioral hurdles for investors, leading them to overestimate their ability to spot the next big thing or accurately forecast market movements. Such overconfidence often diverts attention away from companies with a history of reliable performance towards those that appear to be future market leaders. Overconfidence can also lead investors to underestimate risks and overlook red flags in highly volatile stocks or sectors, fostering a false sense of security about their ability to navigate market turbulence unscathed.
By favoring novelty, seeking social status, or falling prey to overconfidence, investors might overlook the superior long-term performance potential of high-quality companies, thus contributing to the observed excess returns.
By favoring novelty, seeking social status, or falling prey to overconfidence, investors might overlook the superior long-term performance potential of high-quality companies, thus contributing to the observed excess returns.
A Better Beta?
While the idea that behavioral biases divert investors away from high-quality stocks provides a credible rationale for the excess return to high-quality companies, it flies in the face of notions of market efficiency. After all, if these biases are evident, why haven’t they been competed away by savvy arbitrageurs? An alternative perspective that coheres with behavioral explanations yet also aligns with notions of investor rationality is encapsulated by the low beta anomaly or beta puzzle. This refers to the empirical finding that low beta stocks (stocks that have lower sensitivity to overall index returns) on average tend to deliver higher risk-adjusted returns, in direct contradiction of what is predicted by the Capital Asset Pricing Model (CAPM).
High-quality companies, in addition to their strong fundamentals, typically have stocks with low betas. According to the CAPM, the expected return on a stock is directly related to its beta, which measures its sensitivity to market movements. Higher beta stocks are expected to have higher returns to compensate for their higher risk and vice versa. However, in practice the opposite holds true, with lower beta stocks on average yielding higher returns than would be expected and vice versa.
Higher beta stocks are expected to have higher returns to compensate for their higher risk and vice versa. However, in practice the opposite holds true, with lower beta stocks on average yielding higher returns than would be expected and vice versa.
Fisher Black, famously known for co-developing the Black-Scholes option pricing model, was among the first to spotlight the beta puzzle. In the early 1970s, Black posited that borrowing limitations might be a key factor behind the low beta anomaly. The CAPM presupposes that investors can freely borrow and lend at the risk-free rate, allowing them to adjust their leverage to meet their preferred risk levels. Black noted that in practice, investors faced restrictions on leverage, preventing them from achieving their desired beta through leverage adjustments alone. Consequently, they had to alter their portfolio composition to reach their beta objectives, resulting in the low beta anomaly.
Black’s theory was plausible at the time, considering the high trading costs and assorted frictions which made it hard for investors to access leverage. Yet, half a century later, after an explosion of innovation in financial derivatives and an extended period of ultra-easy borrowing conditions, the notion that investors are leverage-constrained seems almost quaint.
More likely the beta puzzle stems from the inherent limitations of the CAPM itself. As a static model that assumes market equilibrium and provides only a momentary glimpse of how a stock’s expected returns correlate with market returns, it fails to consider the evolution of this relationship over time.
This shortcoming of the CAPM is particularly acute in the model’s failure to account for the tendency of betas to converge during periods of market distress. The phrase “all betas go to one in a crisis” succinctly captures this phenomenon, where individual stock behaviors become increasingly synchronized under severe market conditions. This convergence is largely caused by a widespread rush for liquidity and a collective retreat from risk, as leveraged investors indiscriminately divest assets in their dash for cash. In such times, the unique attributes that typically differentiate stock performances become overshadowed by systemic risk, which exerts a uniform pressure across the market. Consequently, the usual factors that contribute to diverse performance fade into the background, and the collective retreat from risk catalyzes a comprehensive market downturn. This scenario sees individual stocks’ returns align closely with the market average, effectively normalizing betas to one, a shift that CAPM does not anticipate.
This dynamic has the effect of disadvantaging low-beta stocks while benefiting high-beta stocks during crises. High-beta portfolios, which are inherently riskier under normal conditions, experience a relative decline in beta during a crisis, providing a form of wealth protection not accounted for if beta remained unchanged. In contrast, investors with low-beta portfolios find themselves at a disadvantage as their stocks, previously less sensitive to market movements, start mirroring the broader market. Technically, the high-beta portfolio exhibits positive convexity, meaning that losses diminish in relative terms during a crisis, while the low-beta portfolio shows negative convexity, with losses accelerating. Positive convexity is desirable, something investors are willing to pay a premium for, whereas negative convexity, representing increased risk, is something investors expect compensation to endure. And, as market pricing incorporates the convexity associated with different portfolios, the premium attached to low-beta, or high-quality, stocks emerges as a form of compensation for the negative convexity they bear during times of crisis.
But while convexity may well be a piece of the quality puzzle, its impact is likely peripheral, affecting primarily those stocks where low beta coincides with high quality. Moreover, attributing all the excess return to convexity adjustments alone is hard to square with its overall magnitude, which typically ranges from 1% to 3% annually across global equity markets. Even staunch proponents of rational expectations struggle to justify such a rich premium for convexity alone, suggesting that additional drivers must be at play.
A Capital Question
One possible explanation, albeit one that is perhaps a little far-fetched, turns the whole notion of a quality factor on its head by proposing that the phenomenon is less about higher-quality companies generating superior returns and more about lower-quality companies consistently eroding shareholder value. And while this may seem like a distinction without a difference, leading to the same outcome, it shifts the locus of investigation and suggests that one key to understanding the excess returns from high-quality stocks lies in understanding this erosion of shareholder value.
A clue lies buried in the arcana of equity index valuation. Given that stocks are ultimately a claim on future cash flows, a common heuristic for stock expected returns is the inverse of the price to earnings (PE) ratio, known as the earnings yield. Building on this concept, Robert Shiller, in an influential 1988 paper co-authored with John Campbell exploring long-term mean reversion in stock prices, proposed a refinement. He recognized that since earnings fluctuate with the business cycle, a simple PE analysis based on the last year’s earnings would distort expected returns. To mitigate this, Shiller proposed using a ten-year average of real earnings instead of a single year’s earnings in the calculation. This adjustment, known as the cyclically adjusted earnings yield (CAPE), by removing the year-to-year volatility in earnings, offered a more reliable view on long-term stock expected returns by smoothing or removing the effects of business cycles.
Shiller’s research attracted attention for its implications on mean reversion, challenging the dominant idea that stock markets follow a random walk. A less-noticed aspect of his work is how it highlighted the systematic overstatement of earnings. Specifically, his findings showed that, on average in the US since 1870, expected returns as reflected by the CAPE have consistently exceeded realized real returns.
The discrepancy between the expected returns calculated using CAPE and the actual returns achieved by investors, often called earnings slippage, is a puzzle. While this gap exists, it’s relatively small—under 50 basis points (bps) when assessed over the same ten-year period horizon as the CAPE. Interestingly, this gap has been diminishing since the turn of the century, but not because of accelerating earnings growth but rather due to surging market valuations. Given that Shiller’s premise is that valuations mean revert, adjusting for this recent expansion in valuations nudges an estimate of earnings slippage closer to 100bps. While this figure is similar to the excess returns seen from high-quality companies, it doesn’t equate earnings slippage with the excess return to quality directly. However, earnings slippage does suggest an intriguing possibility: perhaps high-quality companies are indeed delivering the true expected equity risk premium, with the broader market persistently falling short.
While it’s nigh on impossible to pinpoint the exact causes of earnings slippage, potential culprits include aggressive pension accounting, the omission of stock option expenses, and good old-fashioned featherbedding and fraud. But the biggest culprit is most likely poor allocation of capital by those responsible for managing the business on behalf of its owners. The connection between bad investments and inflated earnings might not be immediately intuitive, as poor capital allocation decisions typically lead to losses, not inflated earnings. However, the mechanism through which bad investments can contribute to apparent earnings slippage involves the timing of investment gains and losses, along with accounting practices that can obscure the true financial impact of these investments. Investments in corporate jets ostensibly to maximize the efficiency of senior executives come to mind as does the asymmetric nature of stock options that have an uncanny tendency to be reset when things go awry.
The phenomenon of earnings slippage offers another possible explanation for the quality factor. Rather than a reward for superior management and profitability, it might be more accurately seen as a penalty on the rest of the market for its capital allocation failures.
The phenomenon of earnings slippage offers another possible explanation for the quality factor. Rather than a reward for superior management and profitability, it might be more accurately seen as a penalty on the rest of the market for its capital allocation failures.
A Quality Conundrum
The excess returns to shares of high-quality companies almost certainly don’t emanate from a single source. Instead, it likely emerges from a nexus of influences—behavioral biases that divert attention away from solid, albeit less-exciting, investments; a market structure that rewards low-beta stocks, contrary to classical models; and the tangible effect of companies’ capital allocation decisions on their long-term value.
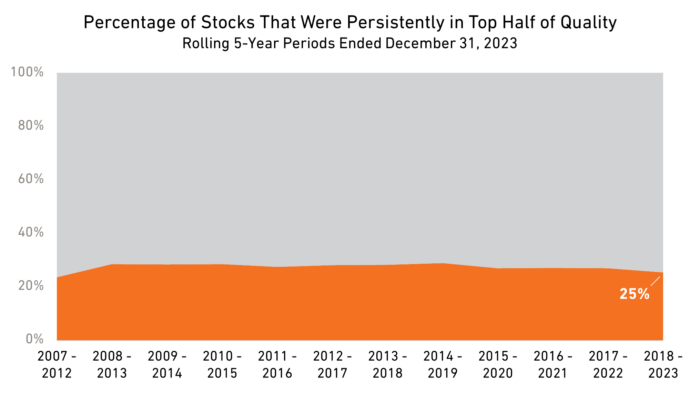
The lack of a single cause for these excess returns to quality means that it cannot be fully automated or left to simple rules-based strategies to be harvested. While these approaches may succeed in catching broad trends, they lack the discernment necessary to differentiate between genuine quality and superficial indicators of performance. This understanding of high quality as a reflection of the wider market’s capital allocation failures naturally leads us to the pivotal role of bottom-up, stock-by-stock fundamental analysis.
A meticulous, bottom-up approach allows investors to peel back the layers of each potential investment, assessing the quality of its management, the efficacy of its capital allocation, and the sustainability of its business model. This granular analysis is crucial to identify companies that not only exemplify the traits associated with high quality in the past but are also positioned to sustain these traits in the face of market volatility and economic shifts going forward. Such an approach recognizes that high quality is not merely the product of a few, easily quantifiable metrics but the outcome of numerous, interrelated elements that require careful consideration. By investing the time and effort into understanding each company’s unique context and fundamentals, investors can more dependably pursue the superior equity risk premium that high-quality companies offer while resisting the myriad temptations to do otherwise. In essence, the pursuit of the excess return to high-quality companies through fundamental analysis is not just a matter of preference but a strategic imperative.


