


Semiconductor makers, NVIDIA especially, have been at the forefront of market conversation for the past several years as demand for generative artificial intelligence (AI) fuels the need for powerful computer chips. Less discussed are the companies one step further back in the supply chain: semiconductor production equipment manufacturers, which provide the specialized tools that are essential to the chipmaking process.
Although investors tend to view this sizable subsegment of the semiconductor industry as a homogenous group, each tool maker solves for a different need—whether, for example, it’s the lithography machines that project intricate patterns onto semiconductor materials, the dicing saws that use those outlines to cut round silicon wafers into tiny individual chips, or the automated monorail systems that transport the delicate wafers from machine to machine to help reduce the risk of factory contamination. This diverse set of companies operates in varying competitive environments, and like their chipmaking customers, their businesses are affected by the technological advances and geopolitical tensions that are dictating changes in how and where chips are made.
To get a handle on the earnings outlook for the tool makers, it helps to put aside the glittering prospects of AI for a moment and observe how the revenue and spending patterns of their customers, the tool users, continue to evolve. In fact, the best place to start is decades before generative AI, when most people took “chip” to mean something else entirely.
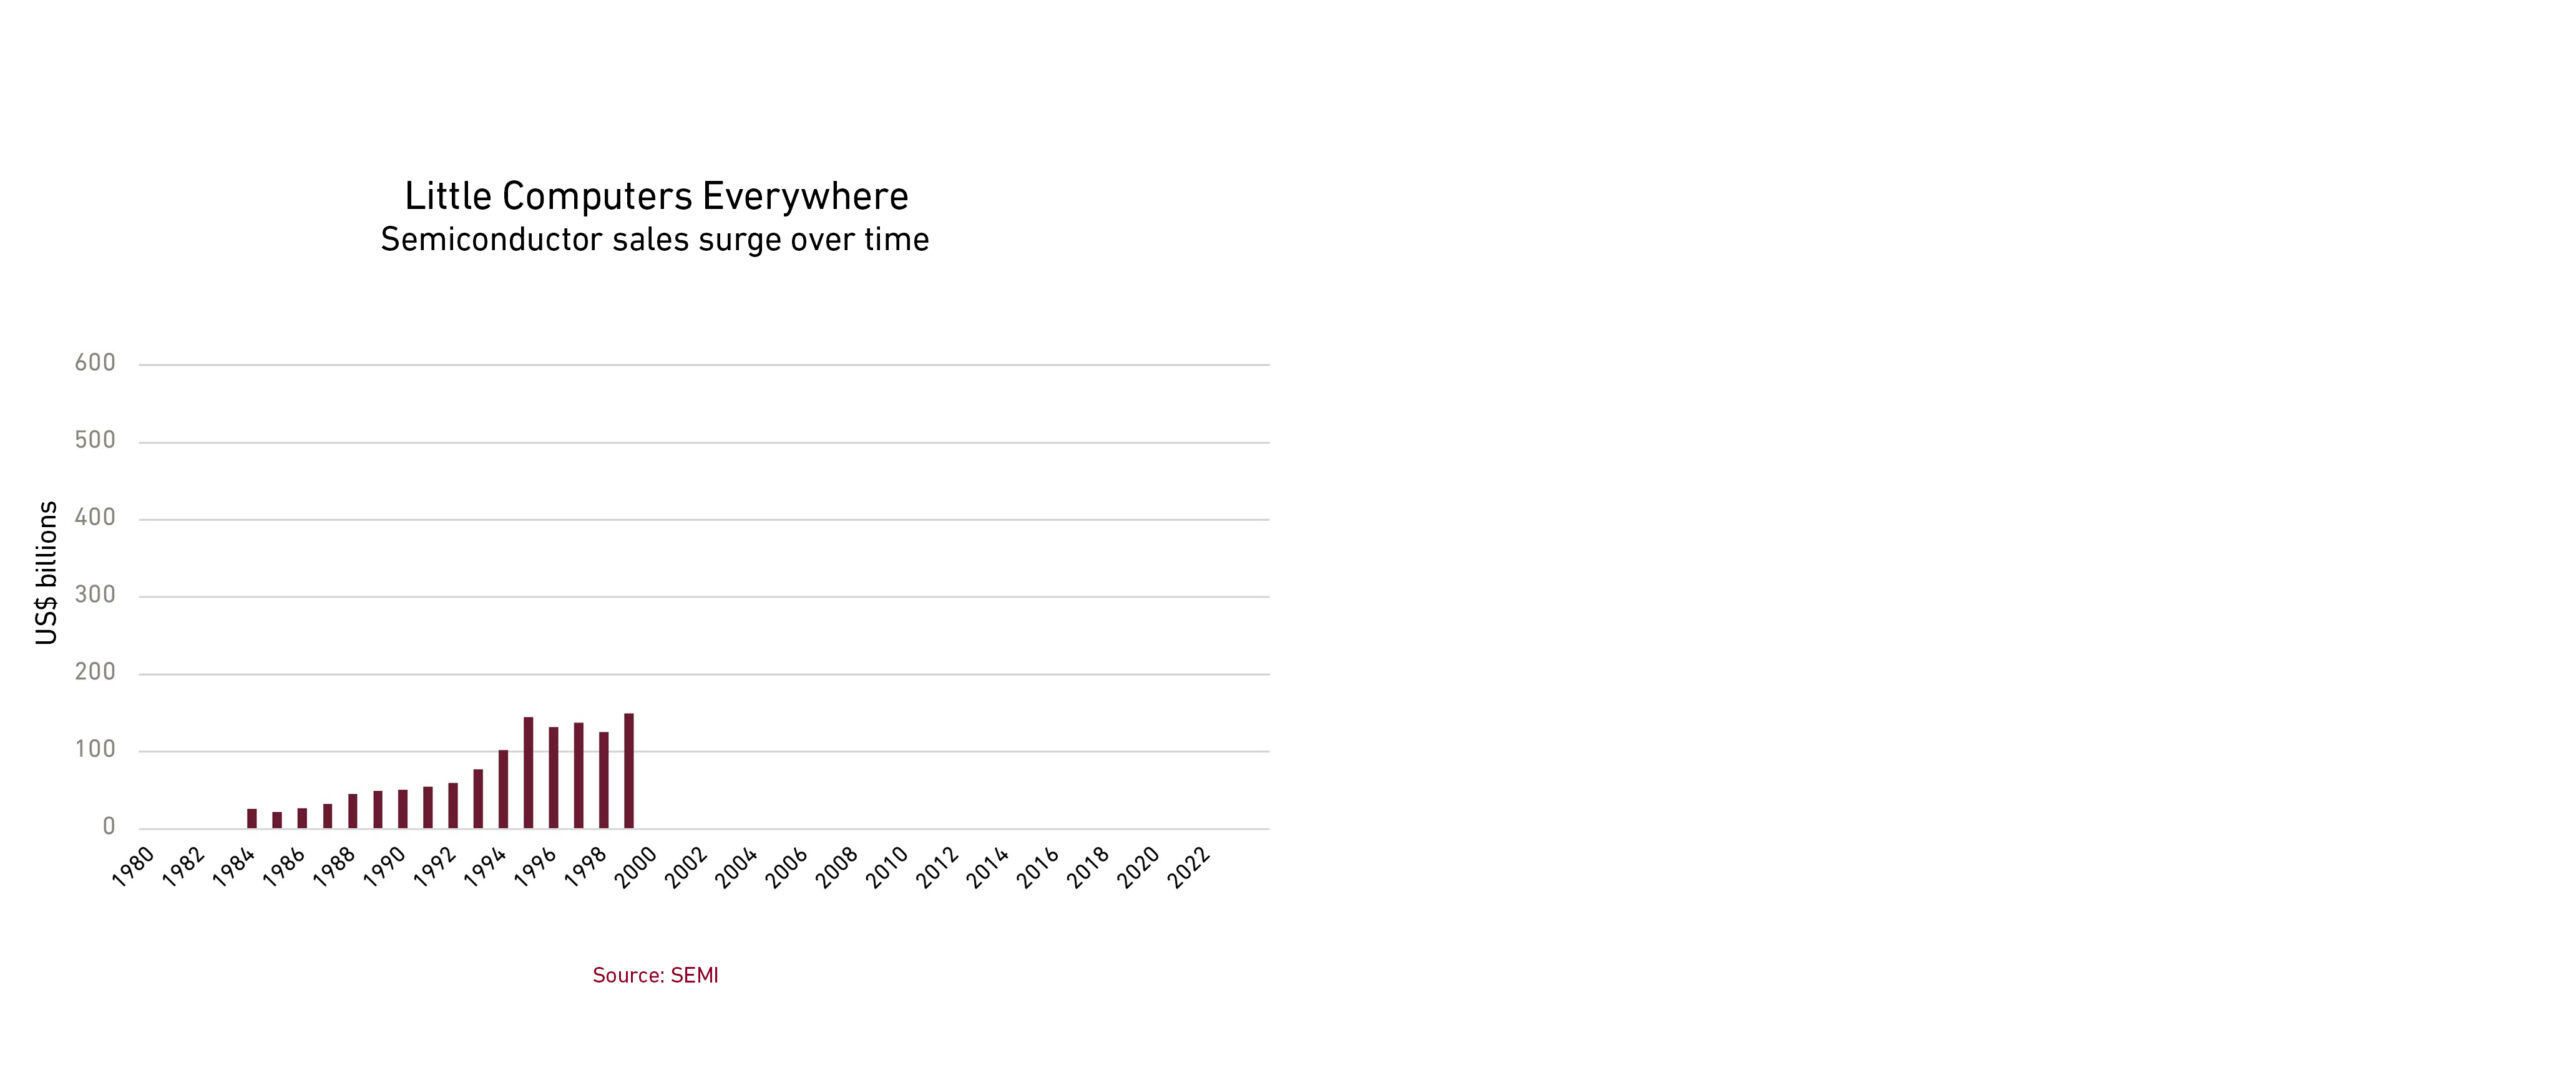
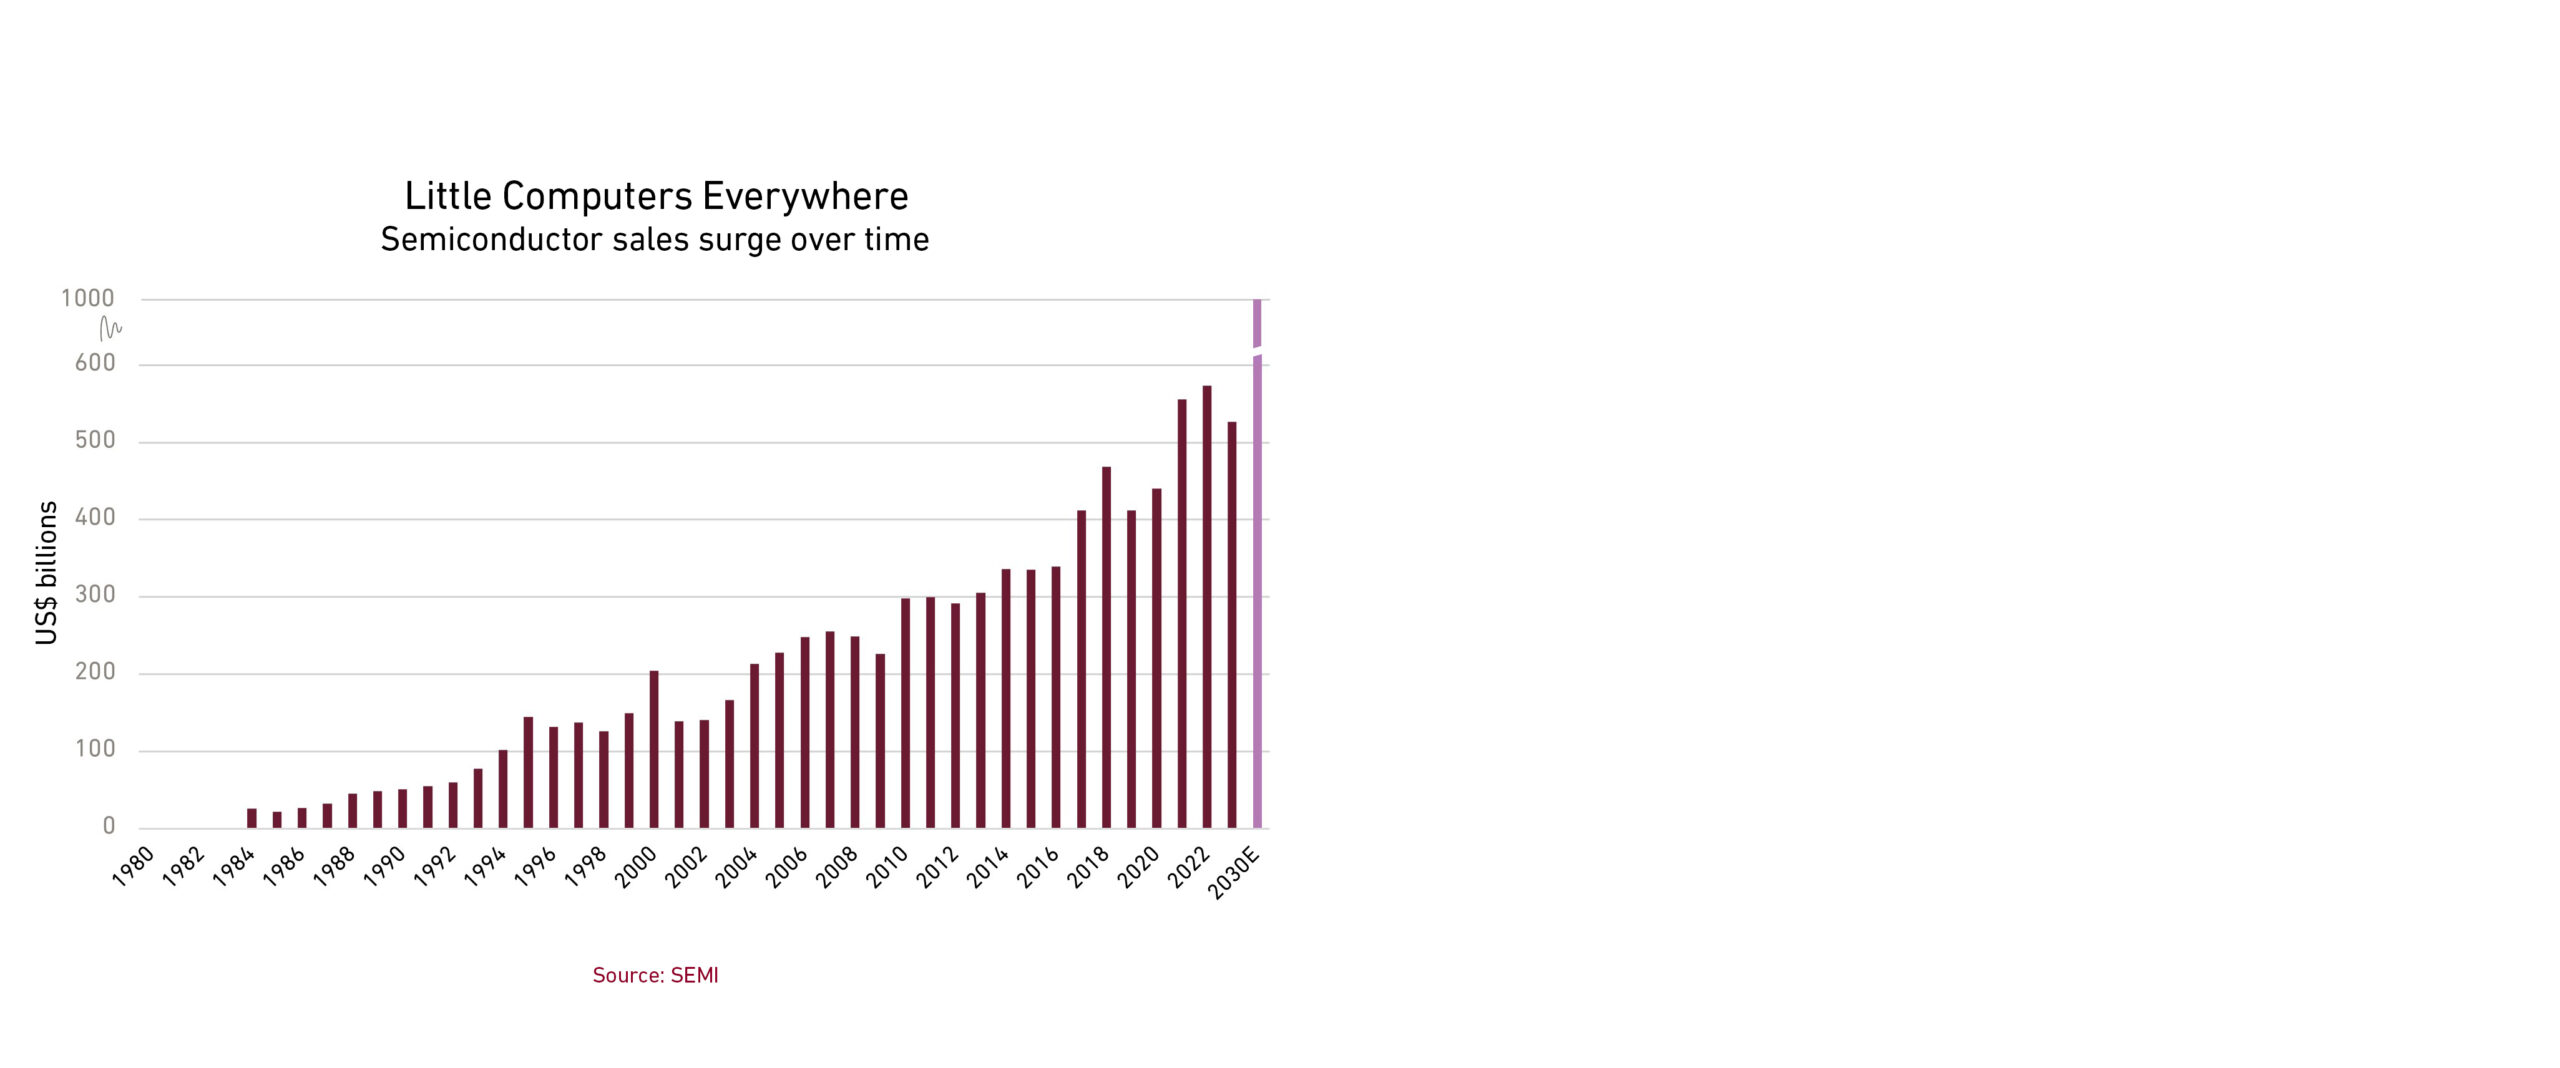
In 1981, “chips” meant crunchy snacks to most people, and semiconductors were barely a US$10 billion industry. General Motors’ car sales were six times as much that year.
But this was a pivotal moment for chipmaking, as it was the year that IBM introduced its personal computer, thus kicking off a multidecade chip boom.
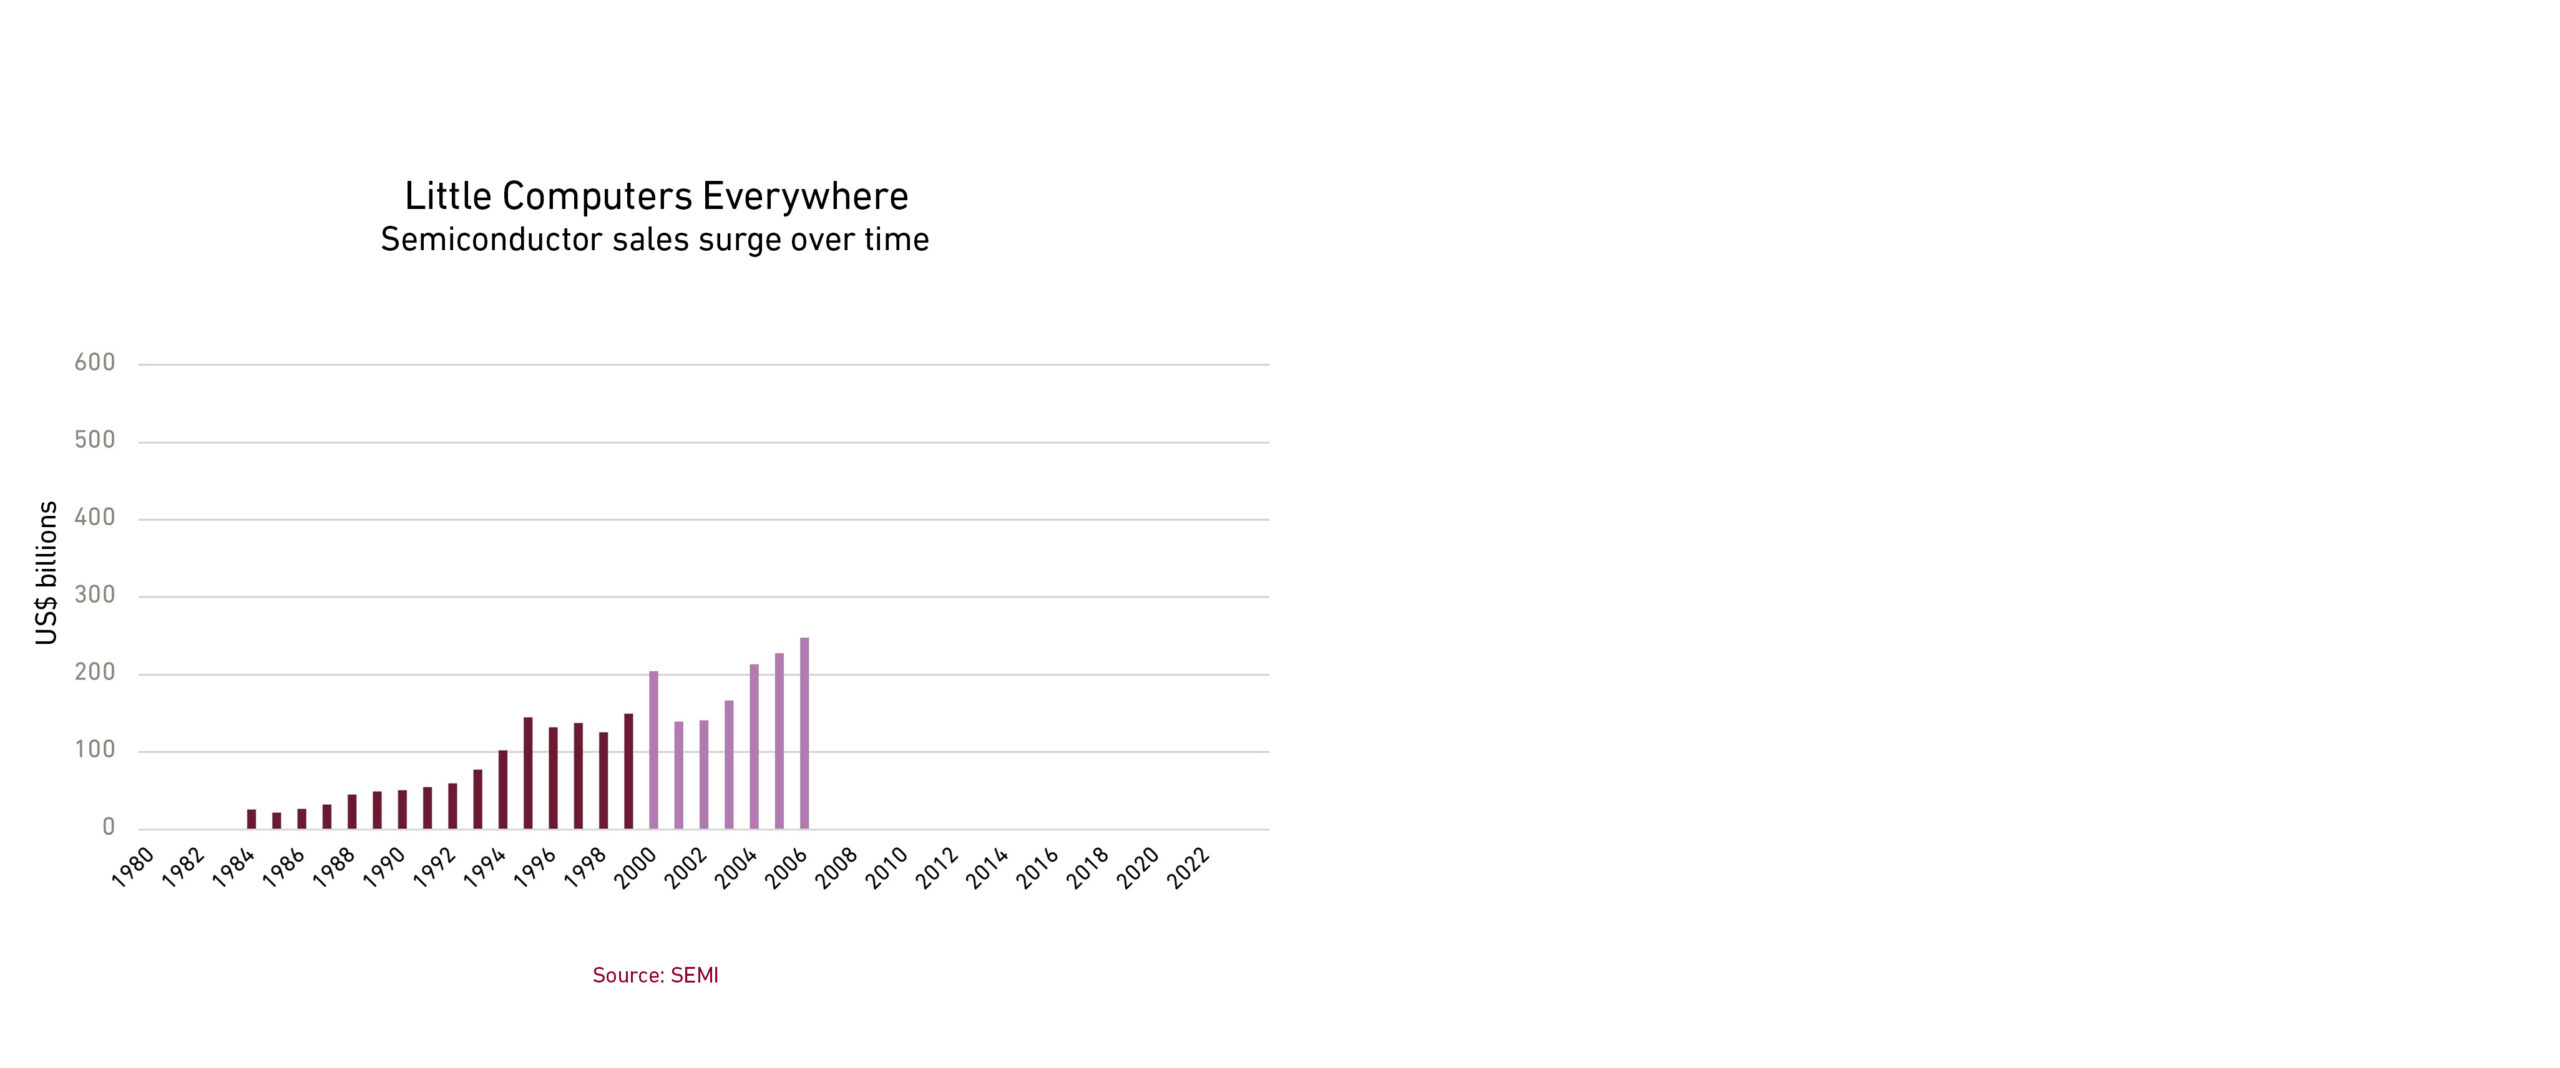
By 2006, most US households had purchased a PC, and chip sales had exploded to nearly US$250 billion globally.
Then came the iPhone.
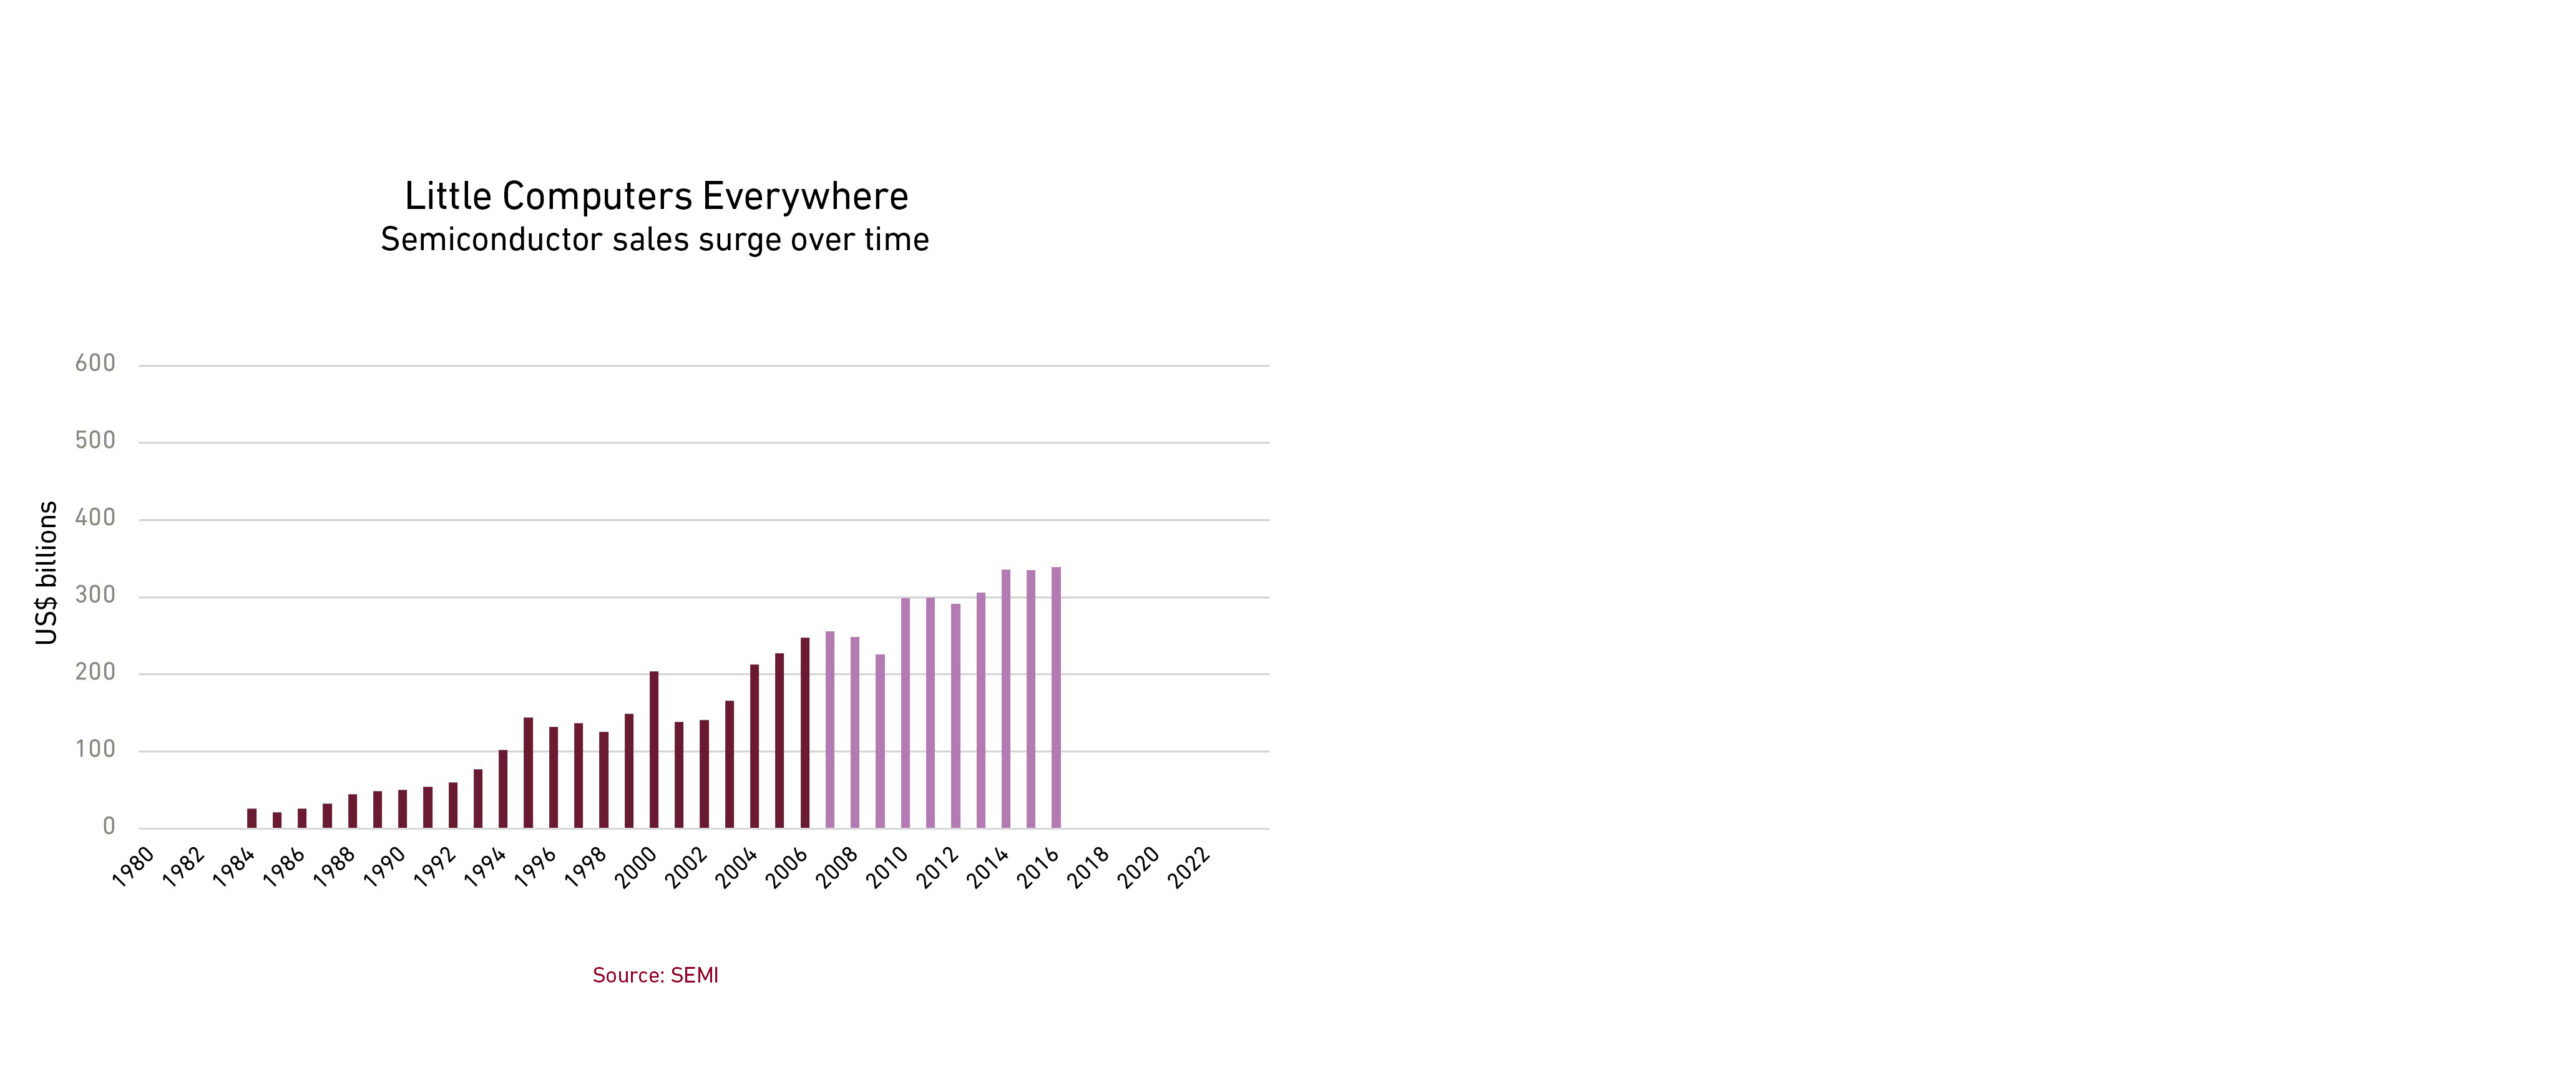
Over the next decade, due to the surge of smartphones and other chip-containing consumer electronics and industrial products, semiconductor sales rose further to nearly US$340 billion.
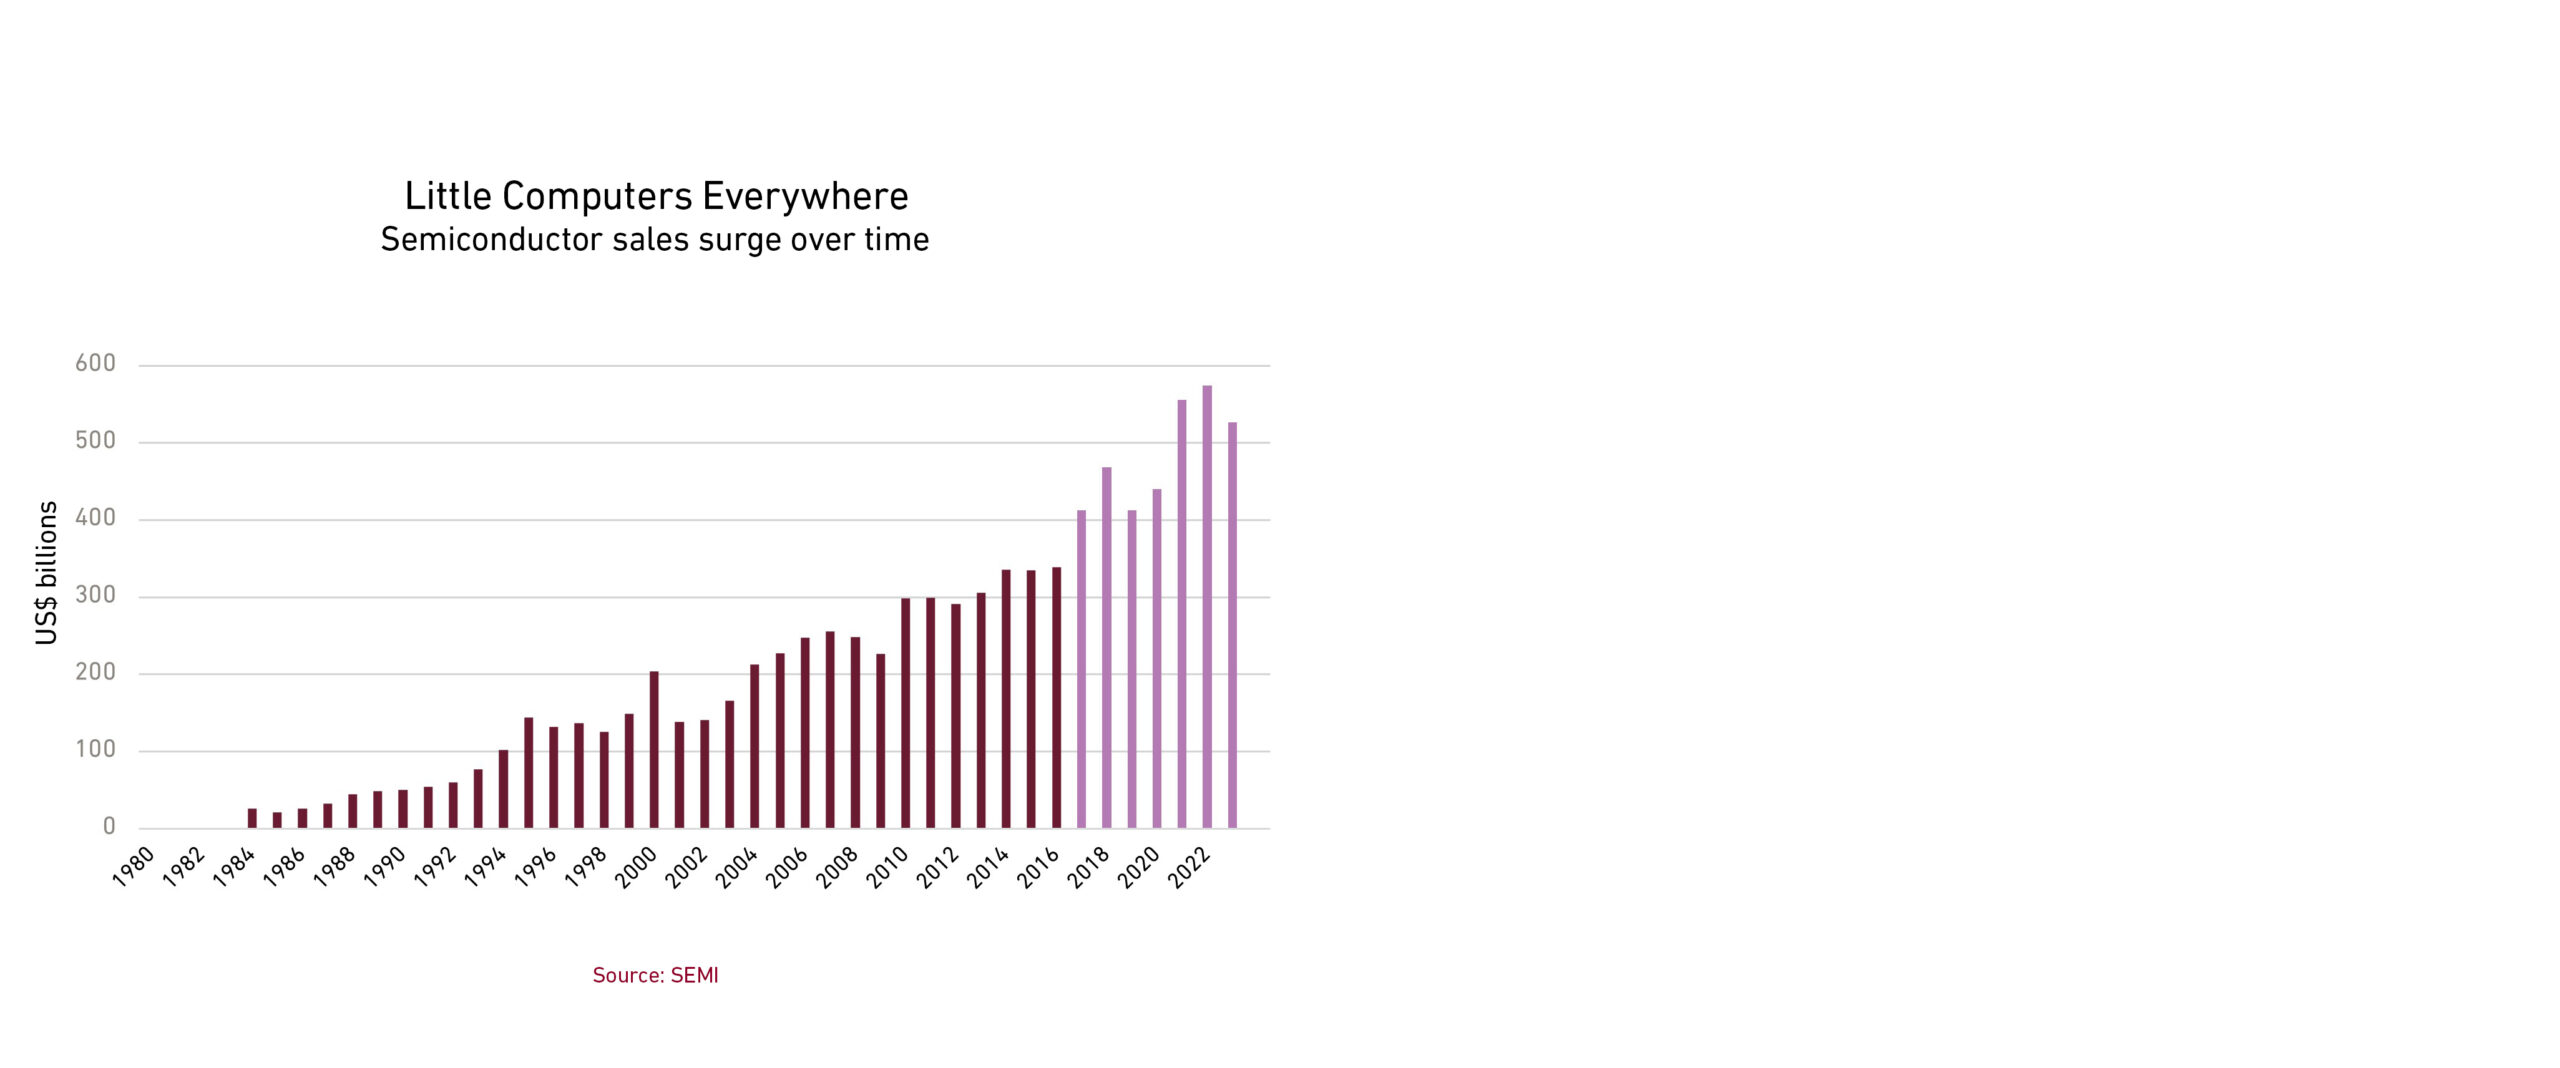
The last few years (save for the temporary disruption during the COVID-19 pandemic) saw yet another boom, which we’ll explore in more detail. But according to the Semiconductor Industry Association, global sales are on track to exceed US$600 billion for 2024.
And in six years, they may reach US$1 trillion.
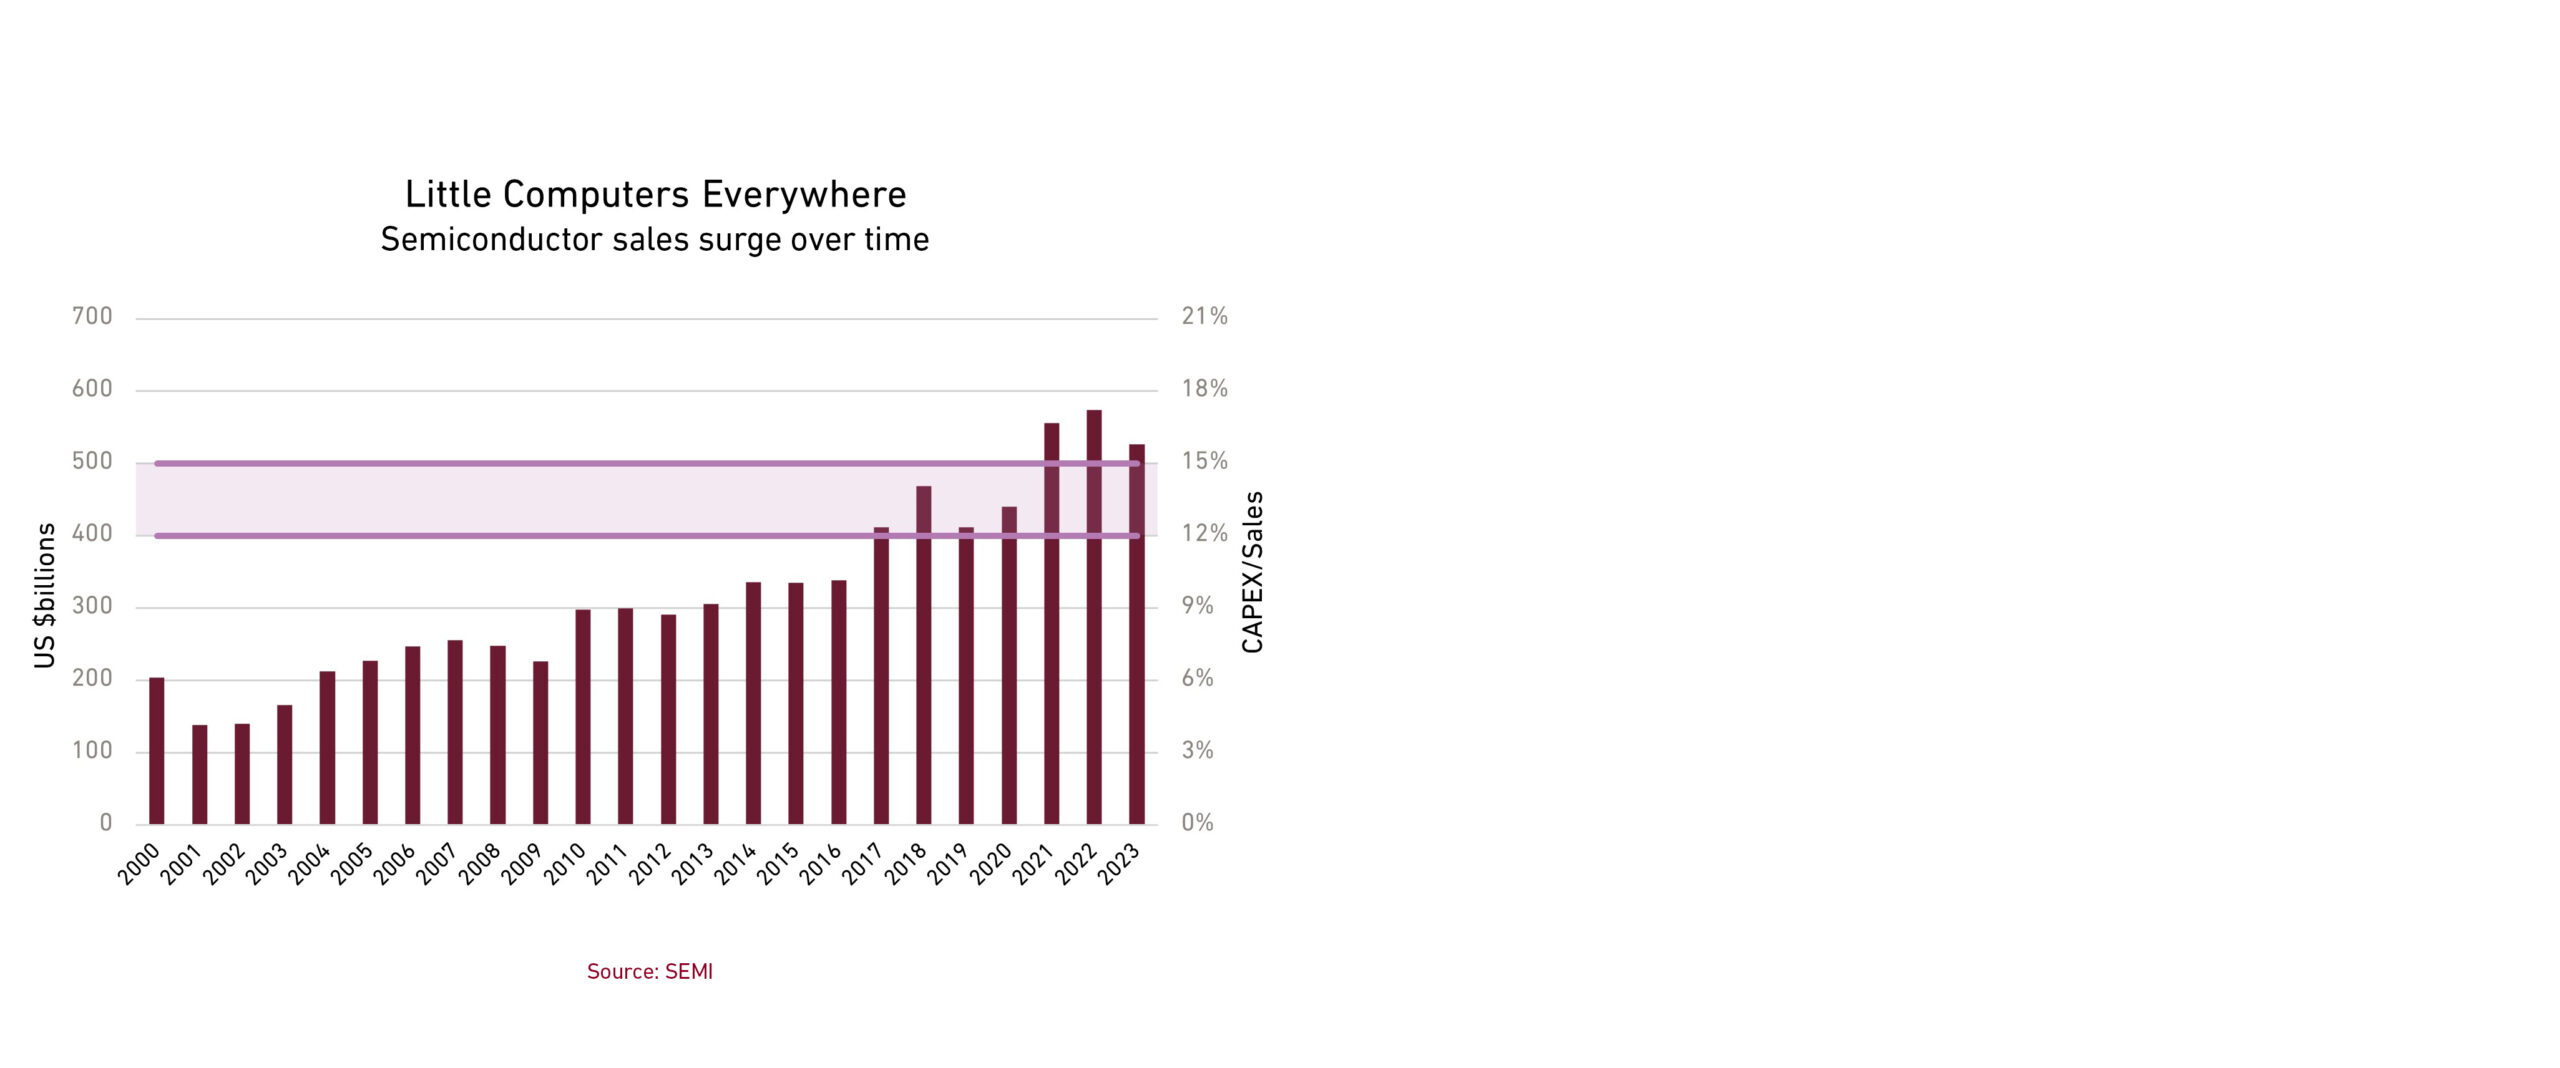
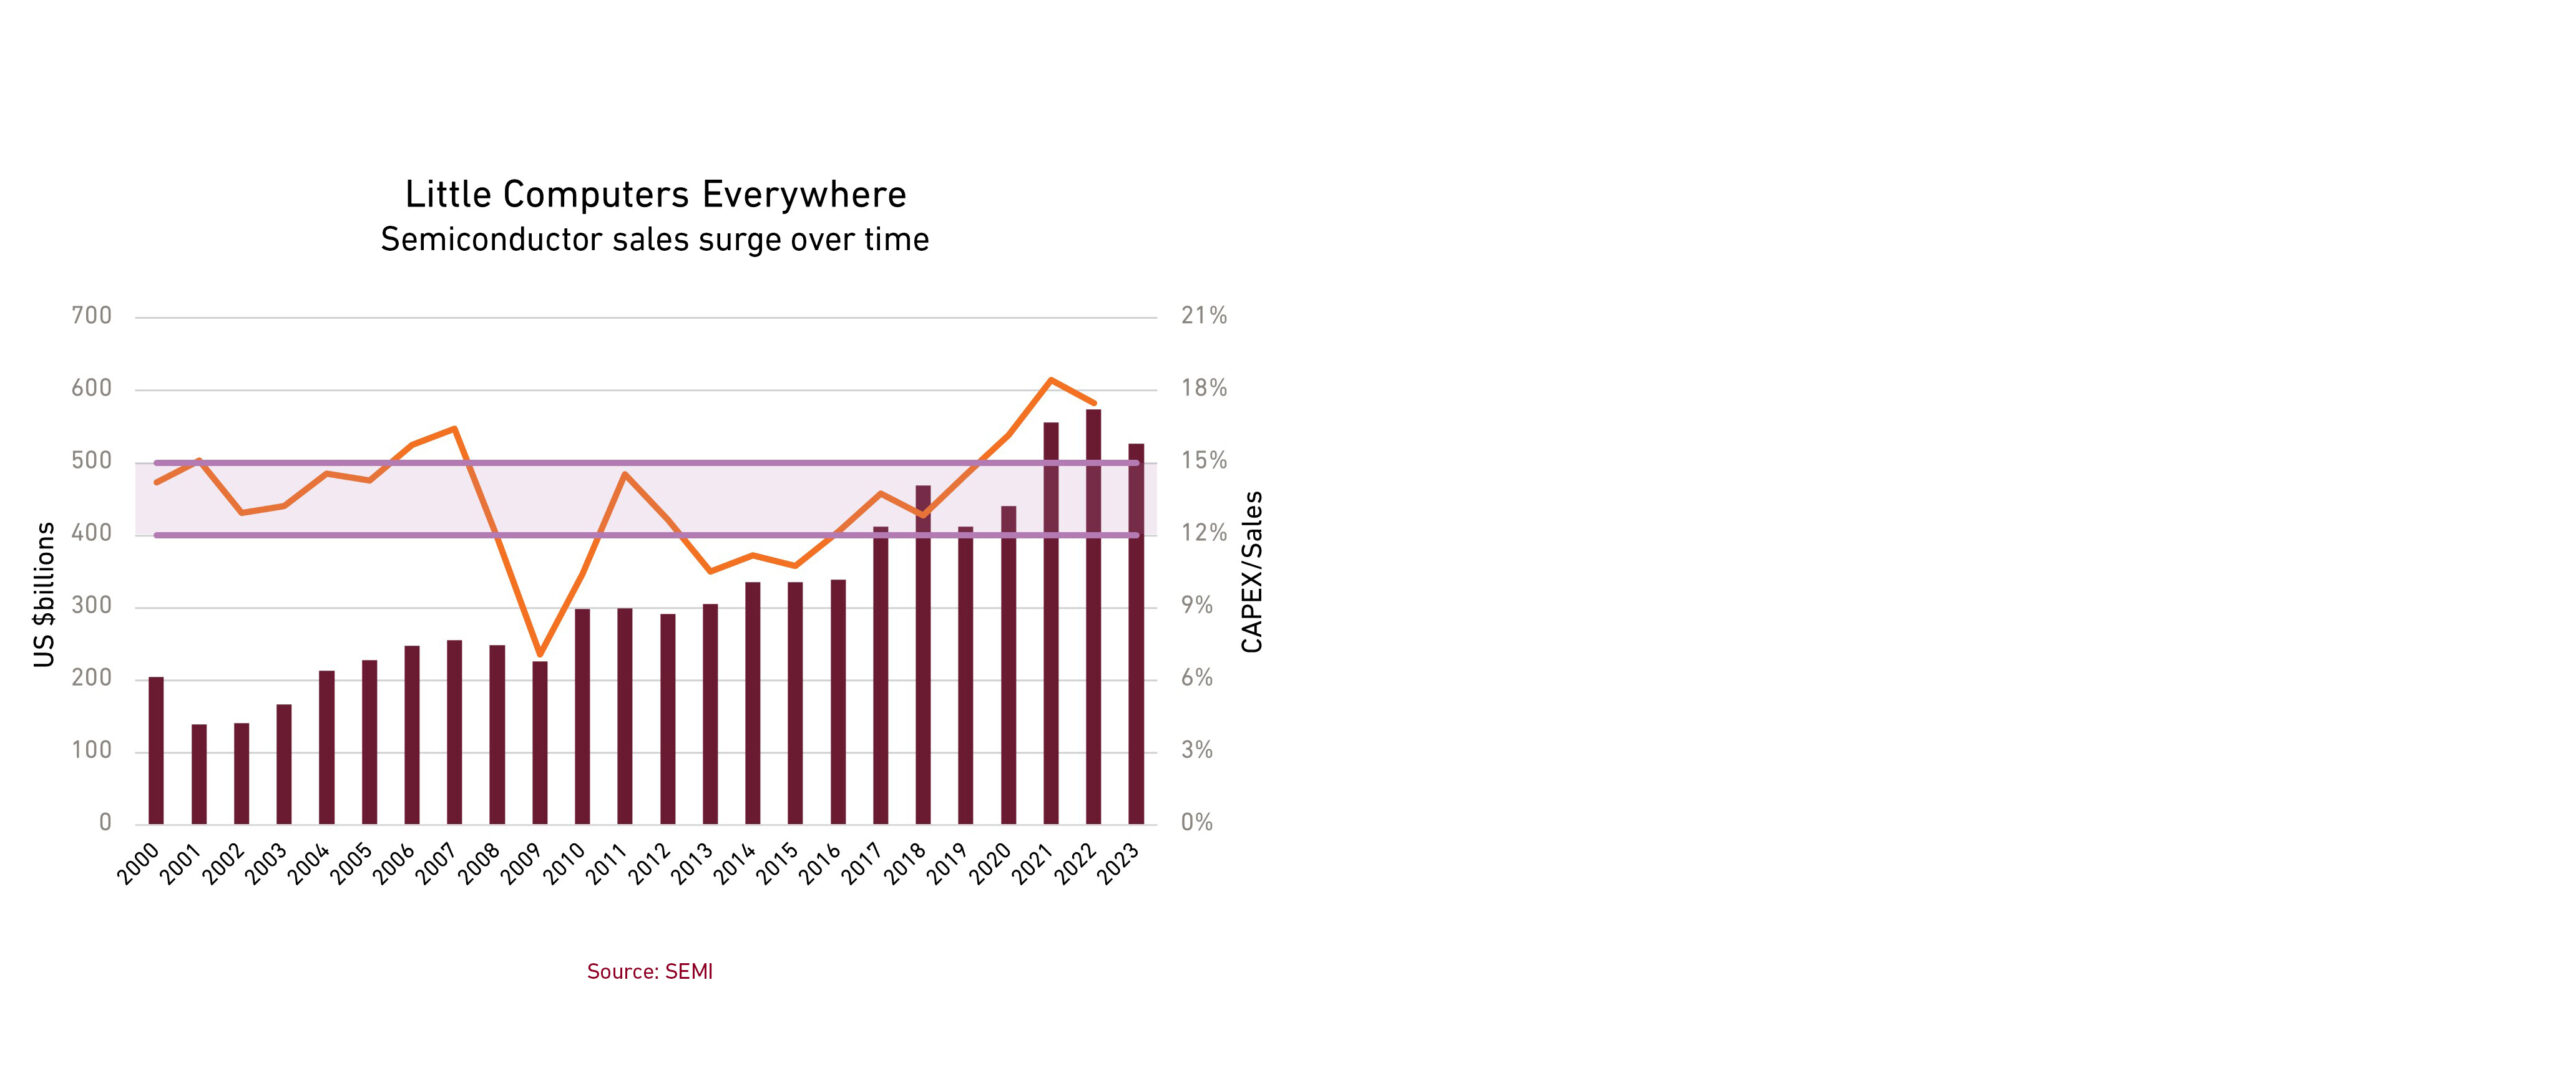
As for the tool makers, long-term aggregate sales have generally grown in line with the total revenue of the tool users, with chipmakers traditionally spending about 12% to 15% of their revenues on capital expenditures. That is a higher level of capex intensity than in the broader manufacturing world.
And yet, in the last several years, capex intensity in chipmaking increased, and global sales for the tool makers topped US$100 billion. This was partly due to the industry adopting more-advanced lithography tools known as EUV (extreme ultraviolet) machines, which can print finer features to fit more transistors onto a chip, making each chip more powerful. Not only are EUV tools more expensive than their predecessors, but also chipmakers Samsung and Intel ramped up spending on this technology to try to catch up to industry leader TSMC.
On the equipment side, the main beneficiaries of the EUV transition have been Netherlands-based ASML, which is the sole maker of such machines, and Japan-based Lasertec, a leader in photomask and mask-blank inspection systems, which can detect defects before the circuit pattern is printed onto a wafer. However, capex intensity could start to revert to historical levels.
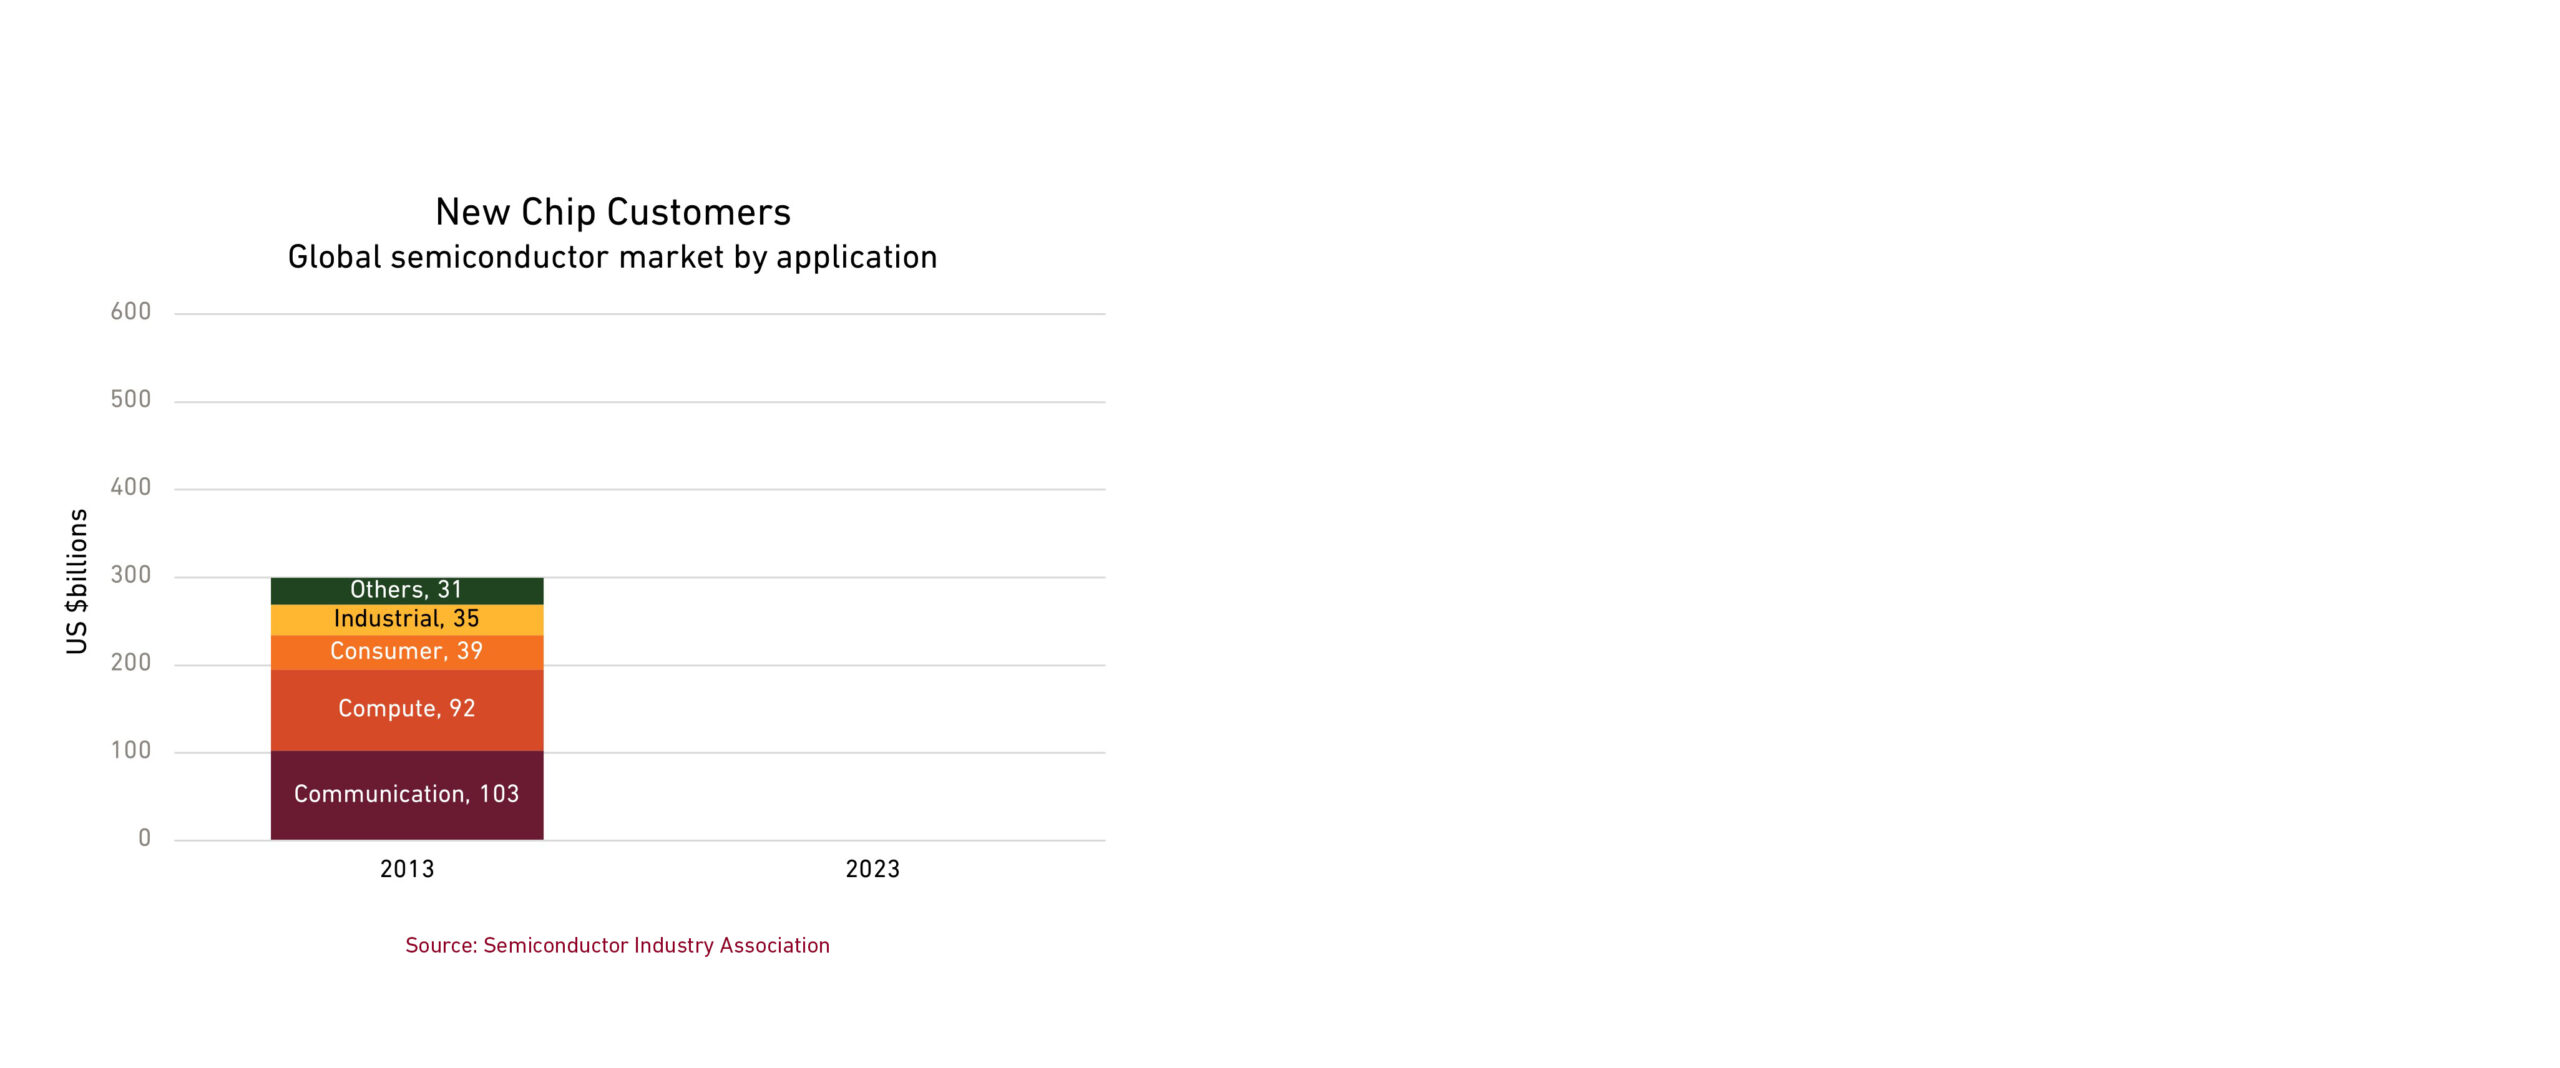
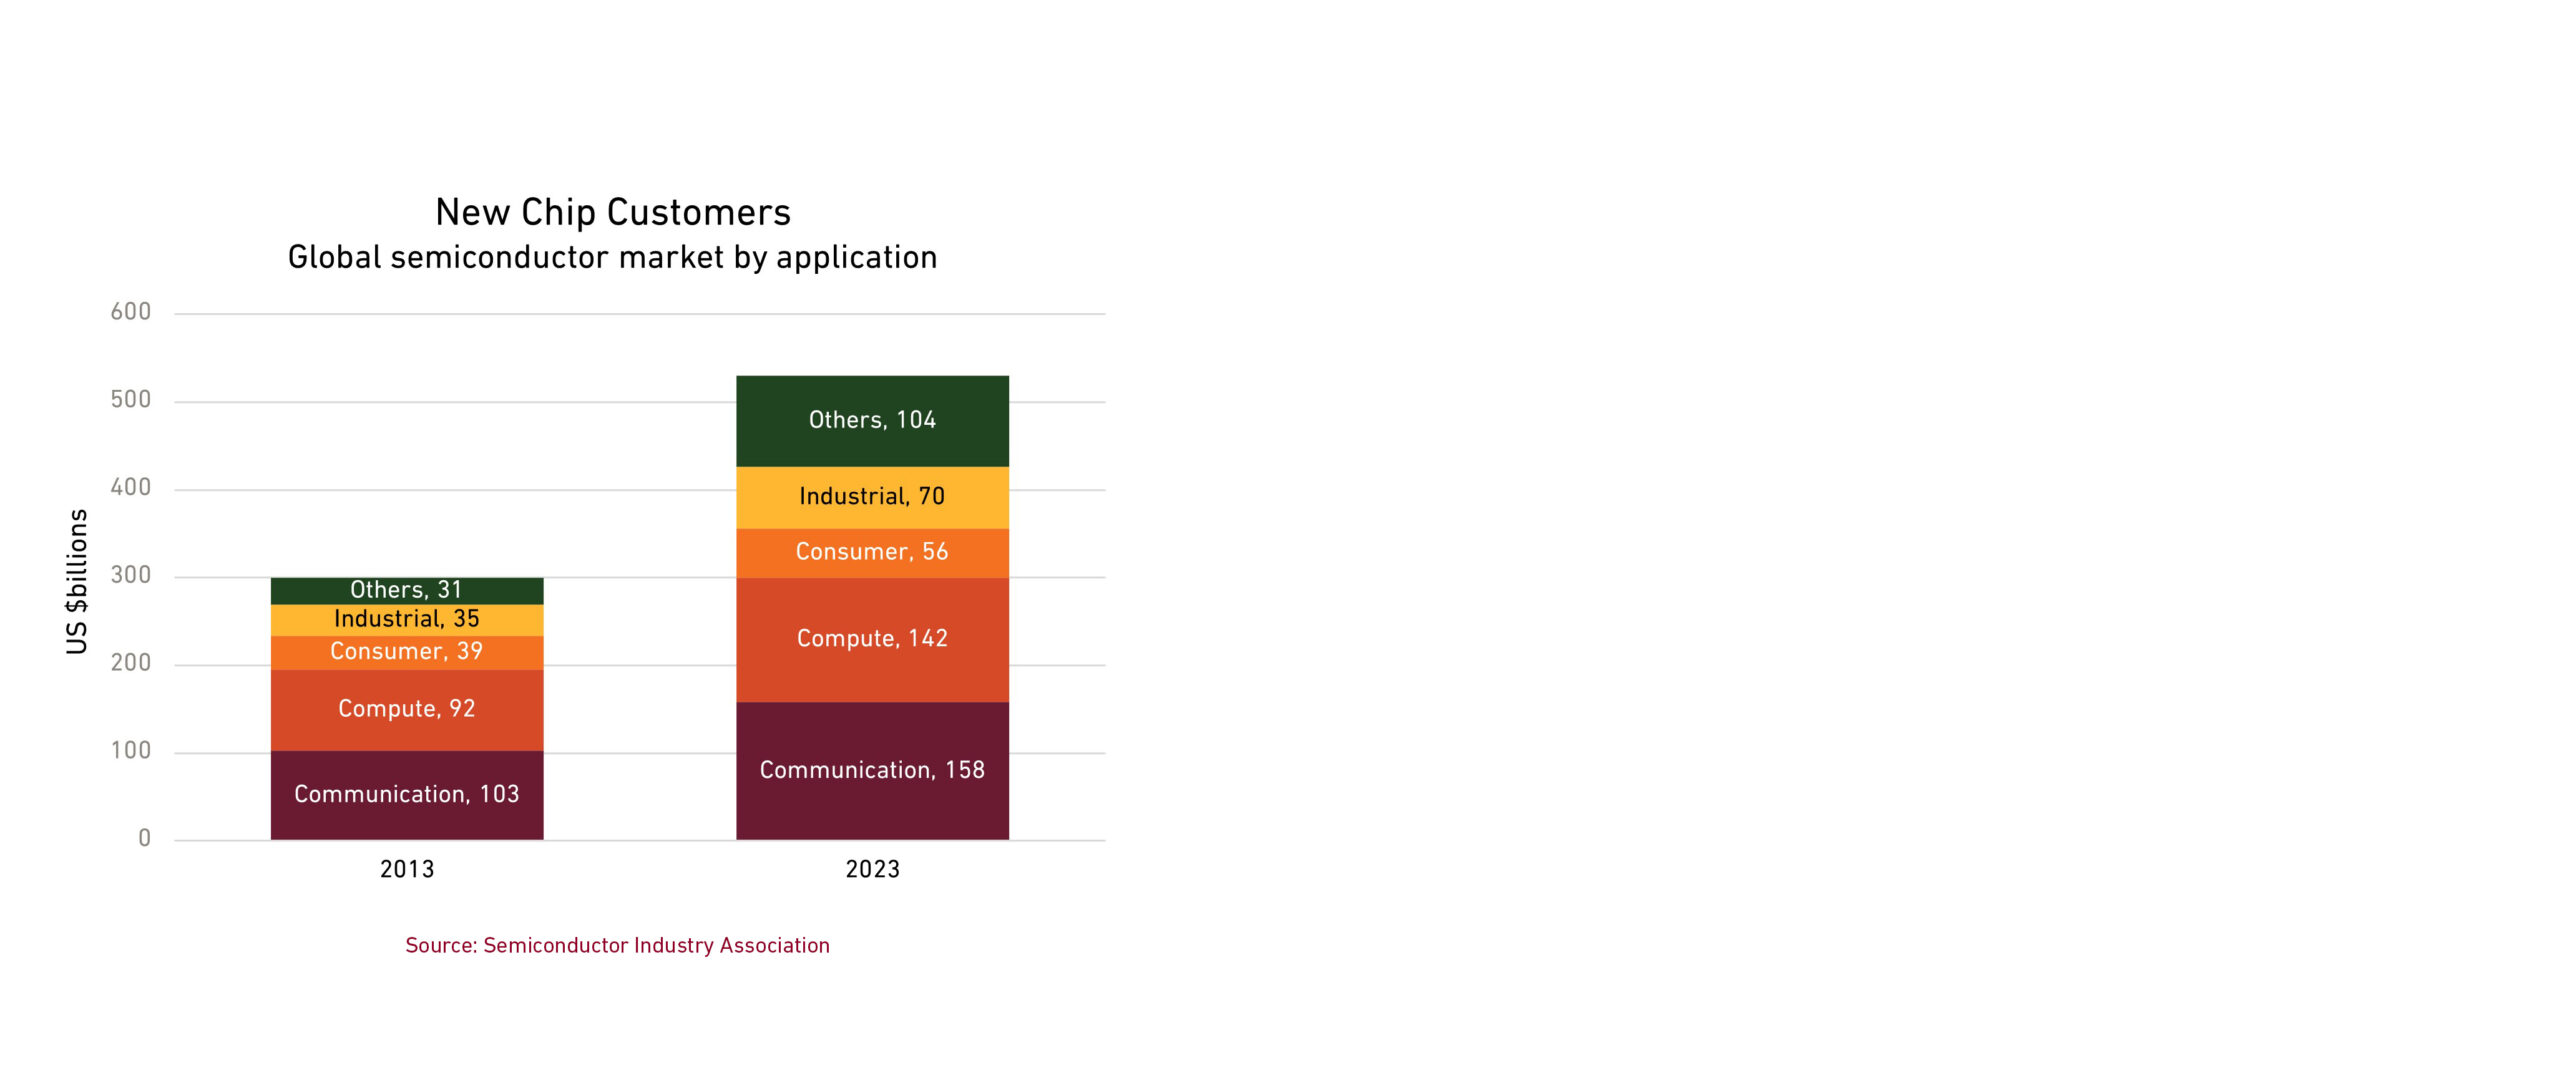
As the production methods change, so are the end users of chips. A decade ago, communications and computing—which are primarily smartphones and PCs, respectively—together accounted for two-thirds of global chip sales.
Now their proportion is closer to half. Much of the new demand is coming from data centers, smart factories, electric vehicles, as well as other cars and trucks equipped with advanced driver-assistance systems. The greater diversity of chip customers may help reduce earnings volatility for both the chipmakers and tool makers.
As chips have gotten more sophisticated to support some of these new sources of demand (compared with the general-purpose chips used in smartphones and PCs), their prices have gone up. However, price will have a limited effect on industry growth. Rather, growth will be dependent on volume, which we suspect will surge.


This is because the physical limits of transistor technology have necessitated a paradigm shift in semiconductor production. Transistors are the miniature electrical switches that control the flow of electricity on a chip, and die are the thin pieces of silicon upon which the circuitry is built. Throughout the industry’s history, chipmakers were able to shrink the size of the transistors faster than the need for computing power rose. Smaller transistors mean that manufacturers can fit more of them on a single die that is then packaged in a protective casing to be a more powerful chip. As the chart shows, the size of each die that is cut from a wafer also got smaller over time.
But in recent years, innovation in transistor size hit a wall, and chipmakers have had to find alternative ways to cram more computing power into every device without incurring prohibitively high costs. This is changing how they allocate their capex, which may have varying effects on earnings growth for tool makers.
For example, in some cases, chipmakers are now moving toward an advanced-packaging method that combines multiple chips into a single electronic device by stacking them on top of one another. While not a new method, they have found ways to create thinner layers to fit more in the same space. This is boosting demand for assembly tools, such as dicers, grinders, and bonders. Disco, based in Japan, is the leading supplier of such tools.
In another packaging method, instead of making a monolithic chip with all components on a single die, companies are building modular die “chiplets.” Each chiplet is designed to serve a specific function, and then they are combined into what looks like a Lego creation. These designs provide chipmakers greater flexibility while improving production yield and reducing manufacturing costs. Although this approach is likely to reduce the need for the most cutting-edge tools, more complex designs do increase demand for testing equipment. US-based Teradyne, for example, is one of the world’s top suppliers of testing equipment.
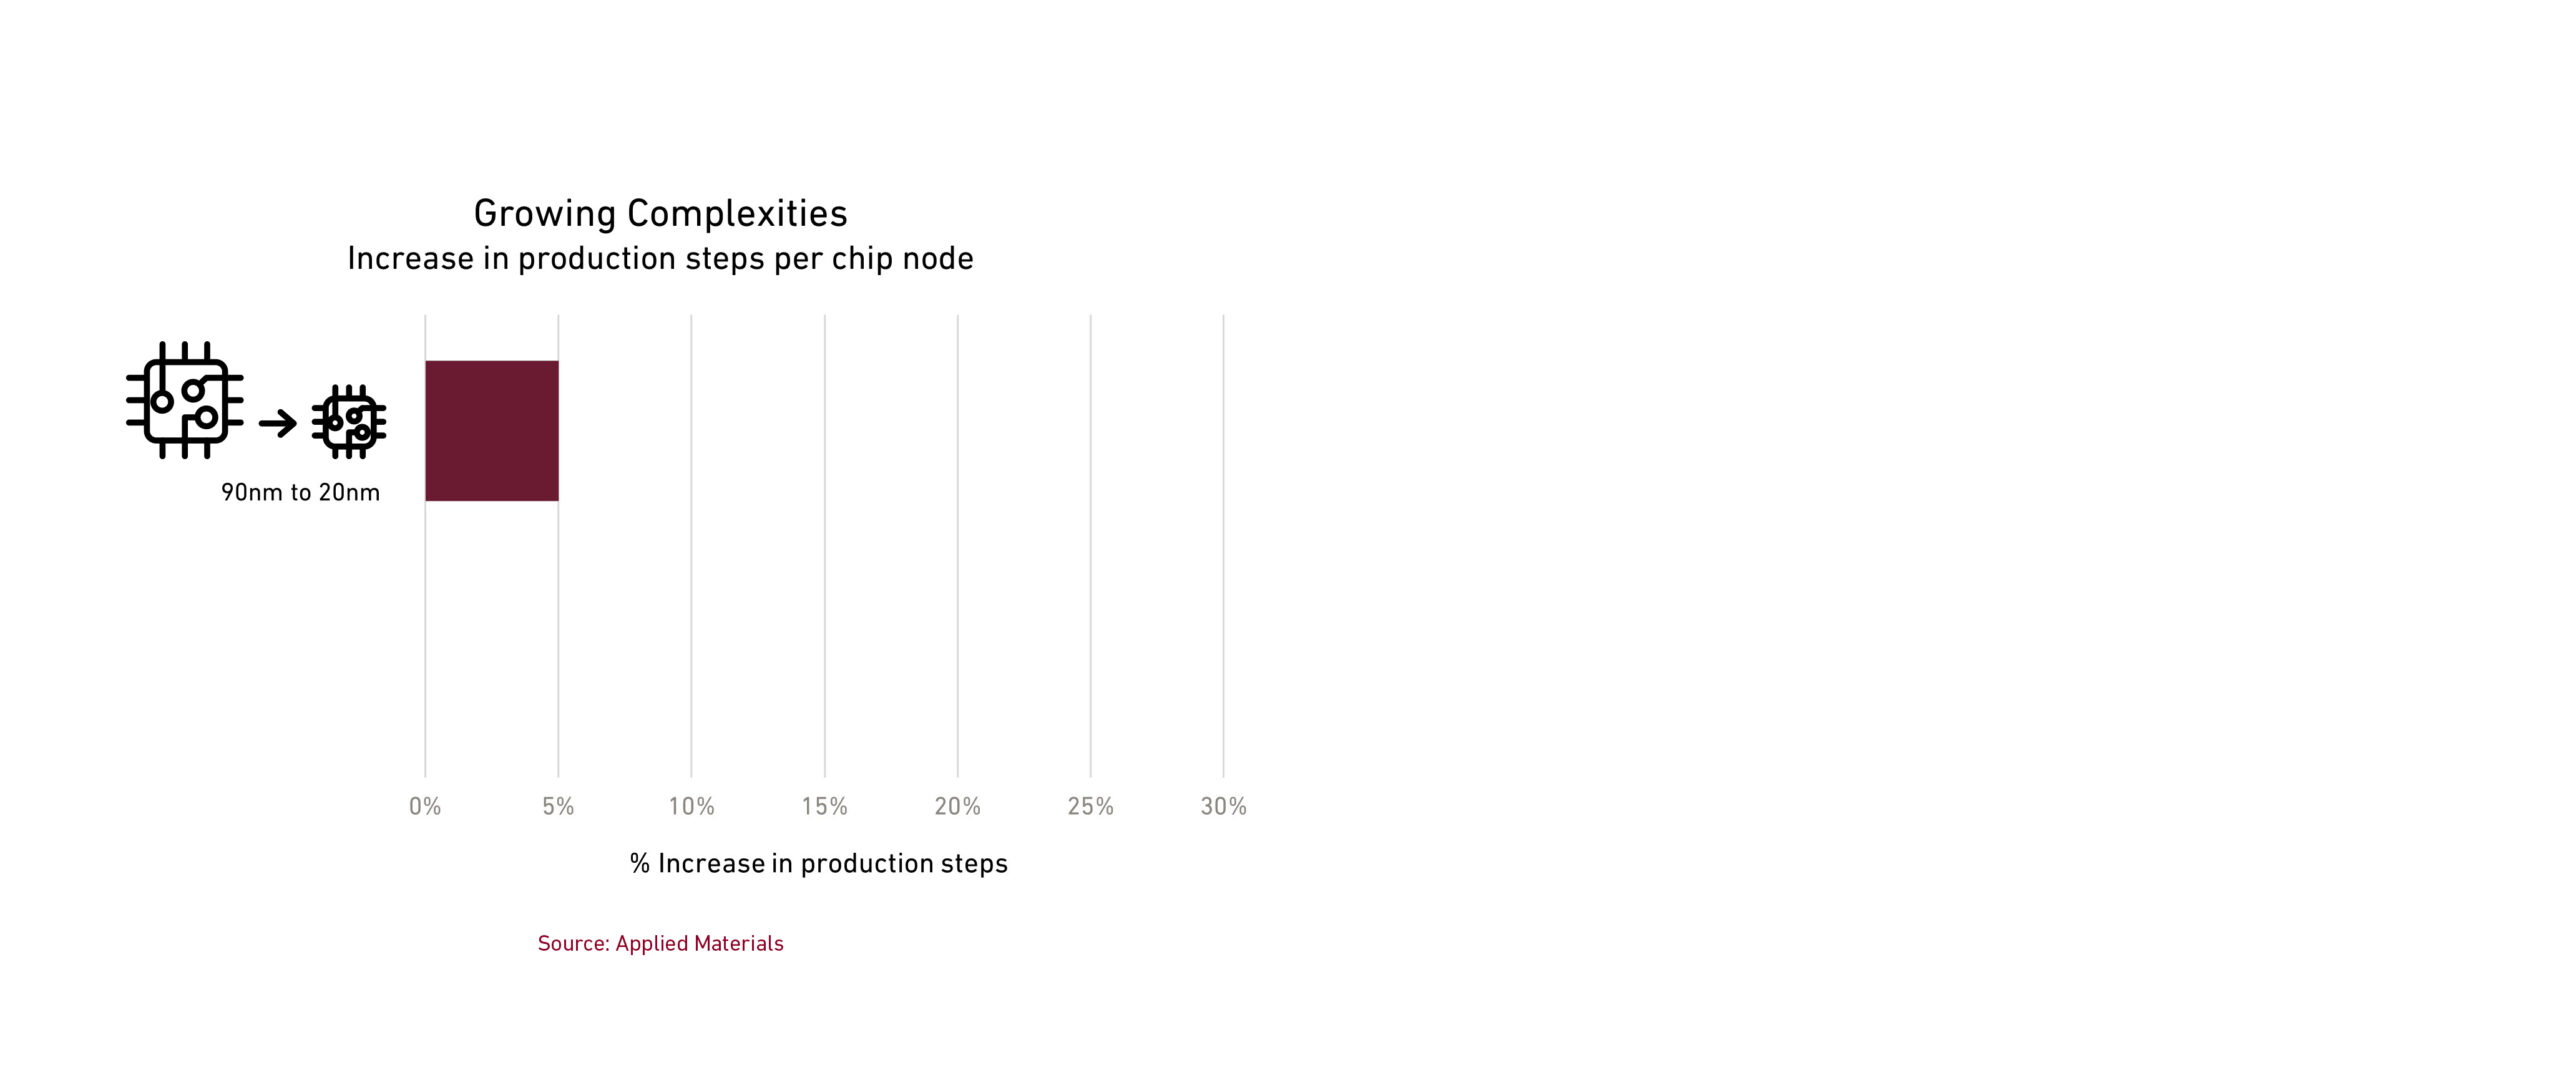
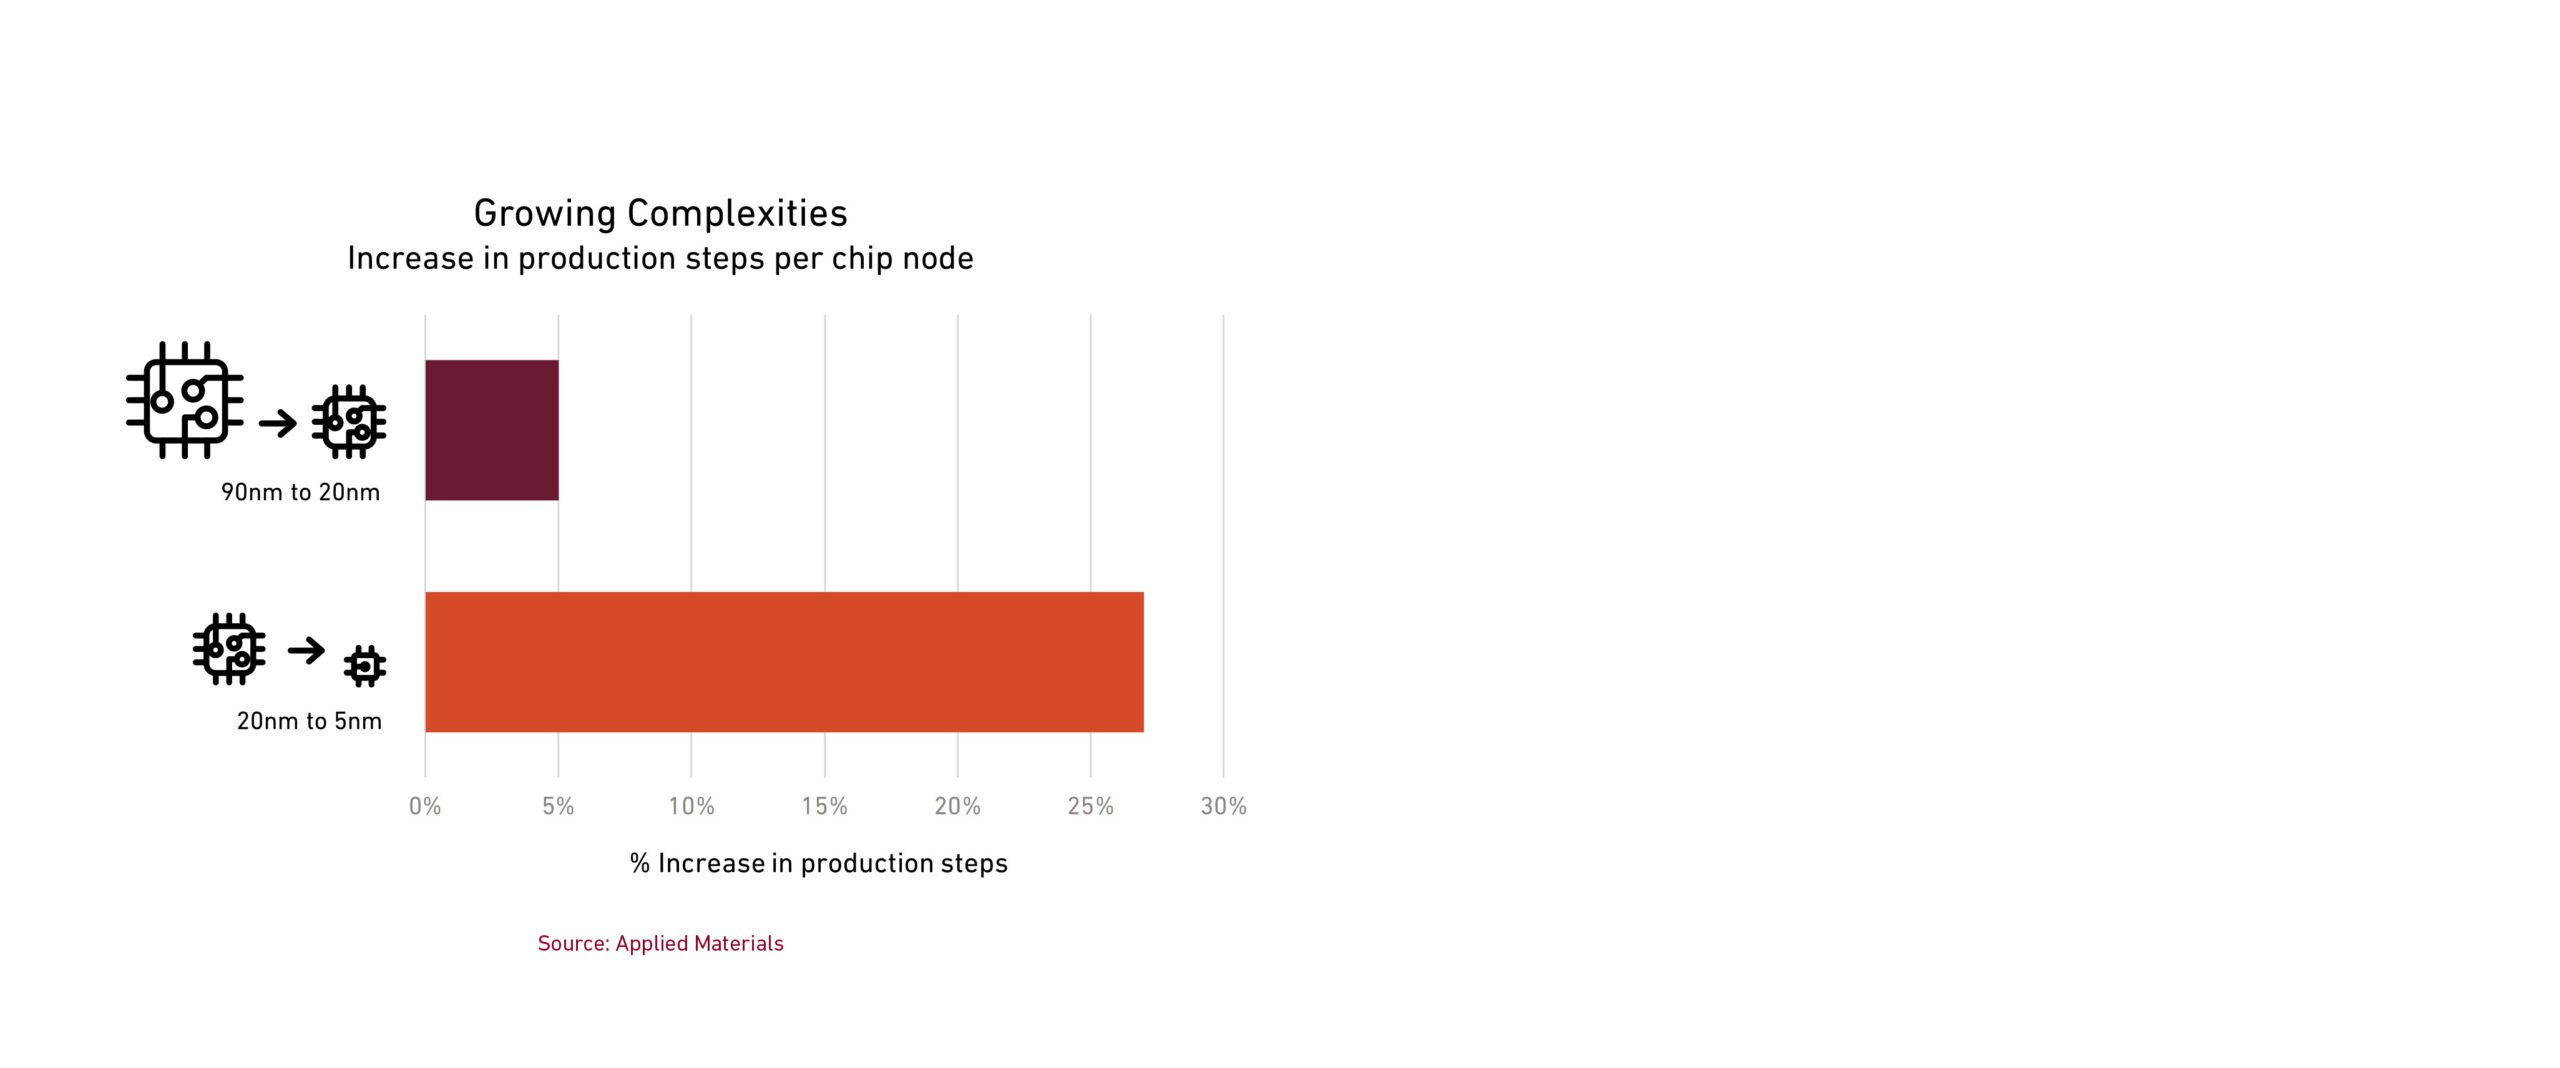
The increasing complexity of making and packaging chips has led to a significant increase in the number of steps involved in the overall production process. Each generation of chip technology is generally referred to by its node, or the size of the smallest feature on a chip. According to US-based tool maker Applied Materials, with each new node, from 90 nanometers down to 20 nanometers, the number of process steps increased by about 5%.
Lately, though, in the shift to smaller nodes, the number of steps has jumped by about 27% each time, as chips have moved from 20 nanometers to 5 nanometers.
Applied Materials and Tokyo Electron are two tool makers that, thanks to their broad array of technological know-how, are better equipped to help their customers limit the number of manufacturing steps.
Even though semiconductor technology is always changing, the risk of new entrants for the tool makers is low. This is because the R&D collaboration between the tool makers and tool users creates high barriers to entry.
But there are at least three key factors that could alter the industry’s competitive structure.

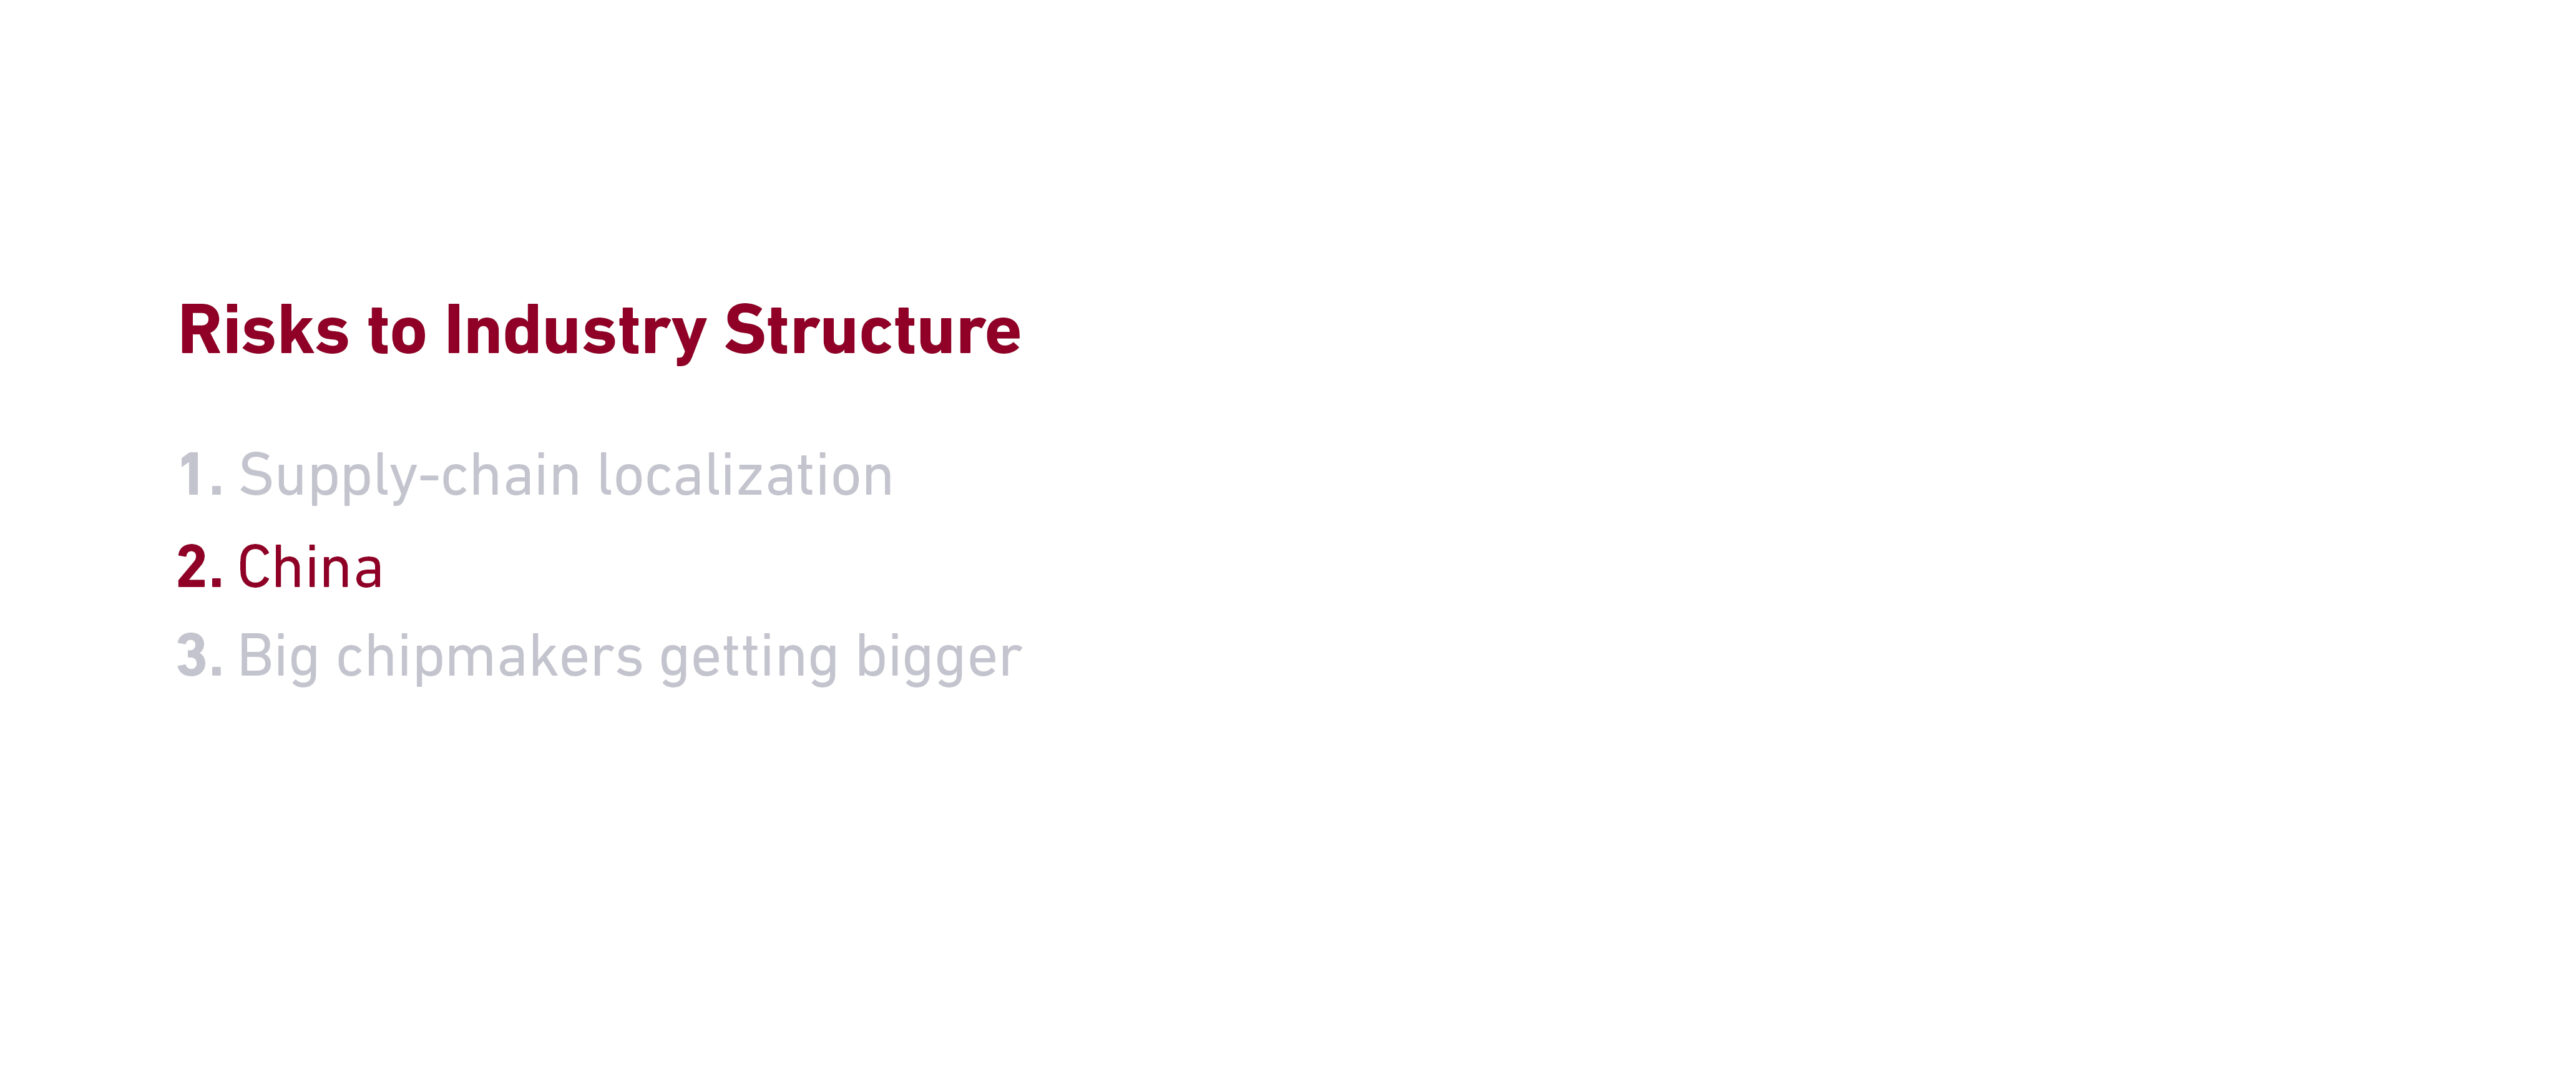
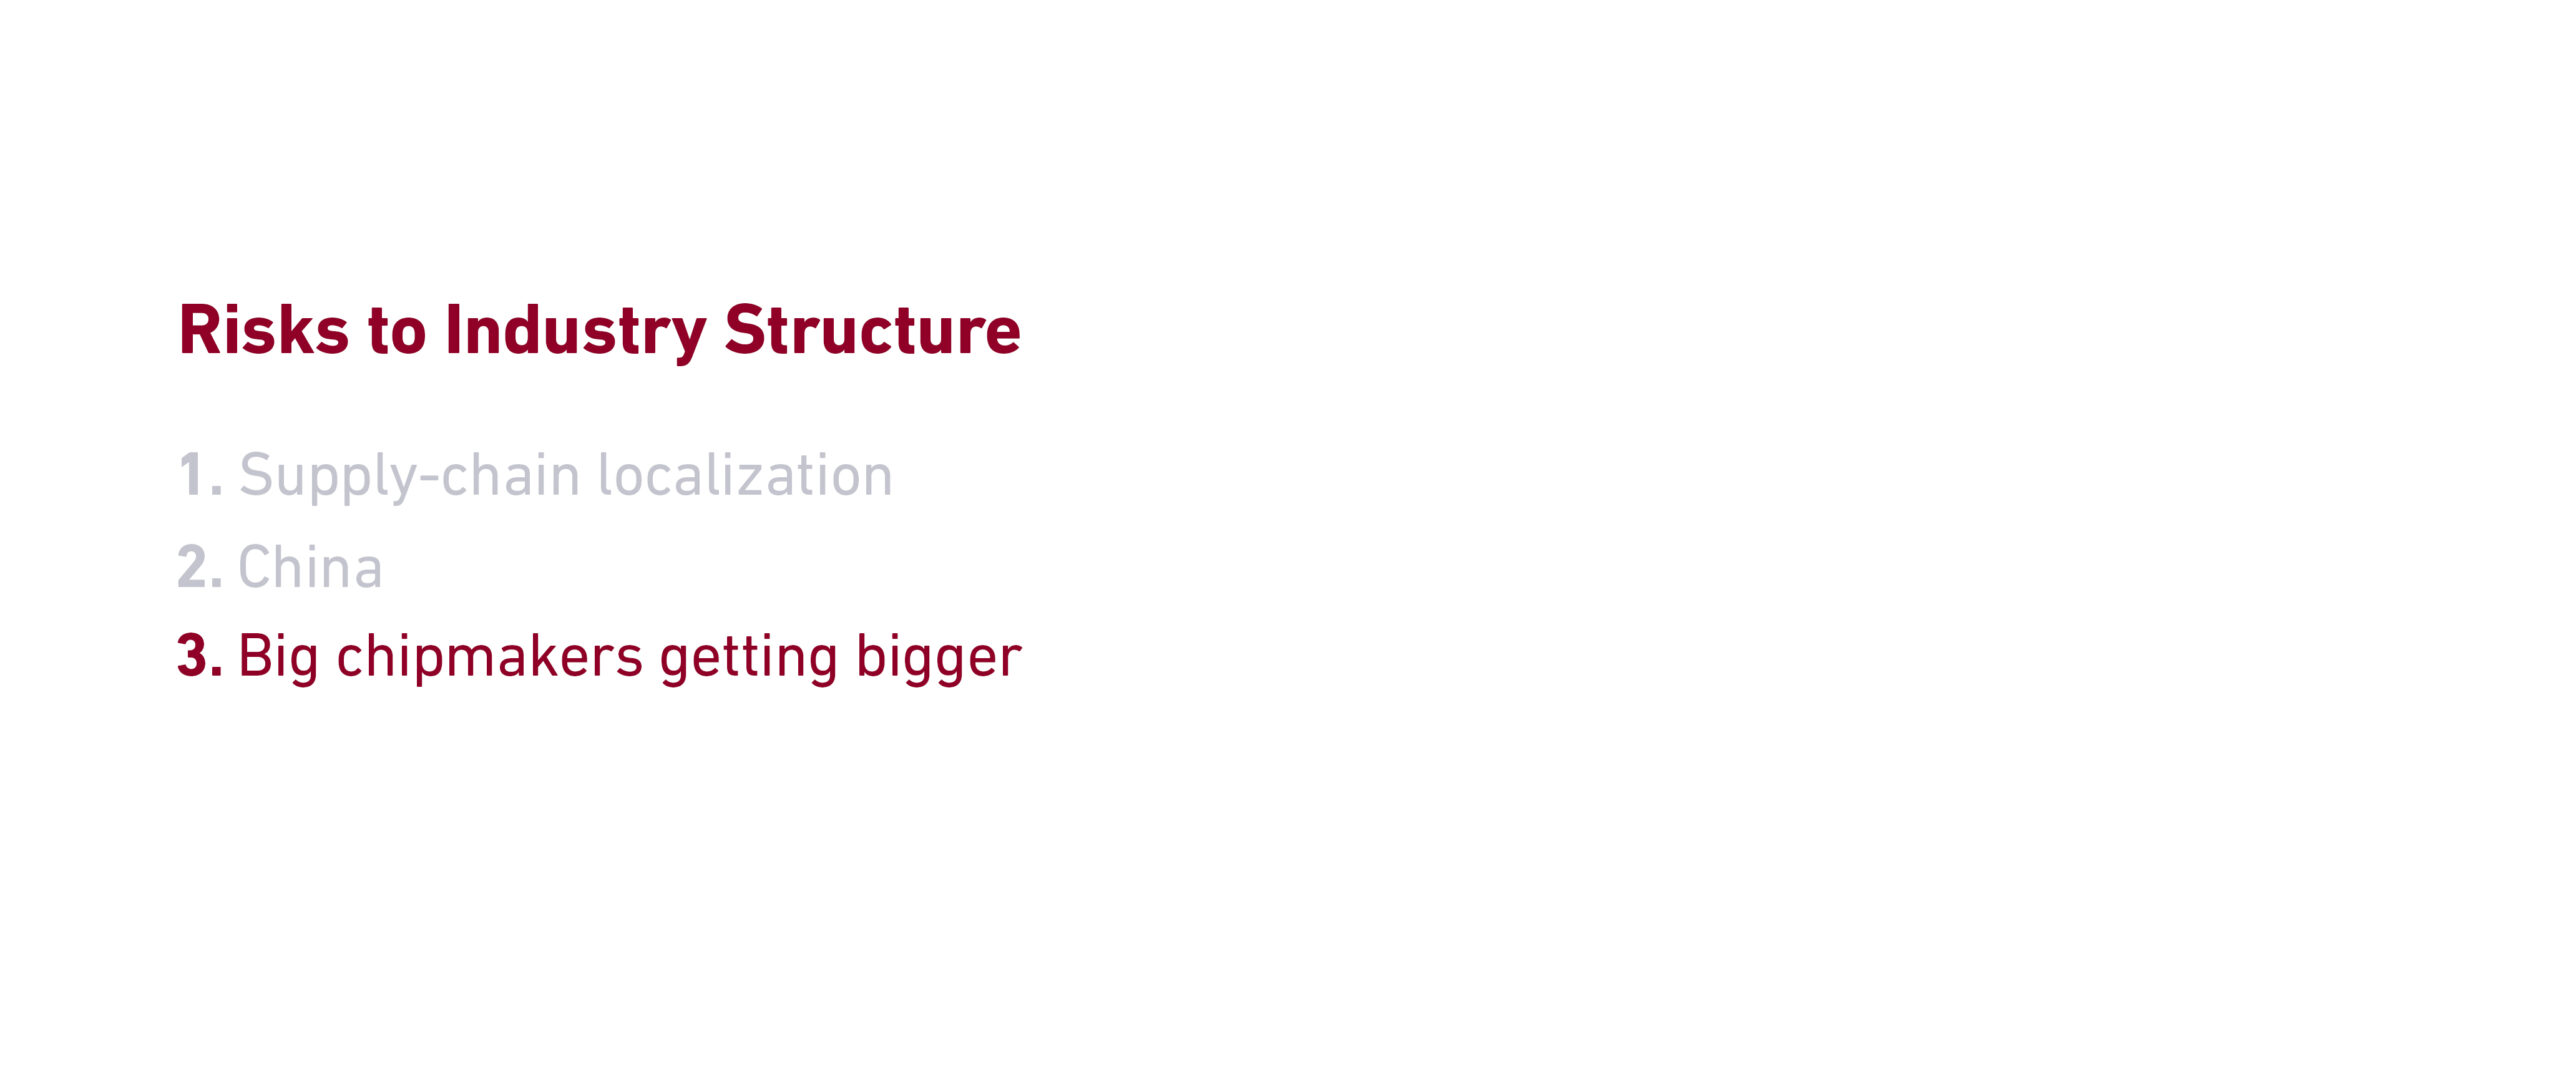
The first is government efforts to localize chip manufacturing. Countries such as the US and China are building local capabilities by offering incentive programs, which enable chipmakers to tolerate lower throughput (the total product produced), meager yield (the proportion of non-defective items), and high costs that are otherwise not economically bearable. New entrants could emerge in response to such policies.
Second, China’s rising competitive presence poses a threat to Western tool makers. The country has been importing a lot of tools lately, which means any slowdown would be painful. But it’s also looking to build its own tools. Furthermore, it’s possible that trade tit-for-tat between the incoming US administration and China results in the latter requiring its companies to use locally made chips rather than importing those made by TSMC, thus reducing TSMC’s need for tools.
Lastly, there is the risk of market consolidation. The growing cost and complexity of chip production has already resulted in many industry mergers, but further market concentration is possible as Samsung and Intel fall behind and TSMC forward integrates at the expense of outsourced assembly and test services. Should TSMC continue to gain market share, it would create downward pressure on capex intensity and increase rivalry among the tool makers. The rising bargaining power of large chipmakers would also weaken tool makers’ profit margins.
For quality growth investors, semiconductor production equipment is an attractive industry. But given the risks—the possibility of slowing growth as capex intensity returns to normal and China disrupts industry demand—it is important to be selective and understand the complicated dynamics at play.
What did you think of this piece?
Disclosures
The “Fundamental Thinking” series presents the perspectives of Harding Loevner’s analysts on a range of investment topics, highlighting our fundamental research and providing insight into how we approach quality growth investing. For more detailed information regarding particular investment strategies, please visit our website, www.hardingloevner.com. Any statements made by employees of Harding Loevner are solely their own and do not necessarily express or relate to the views or opinions of Harding Loevner.
The information provided is as of the publication date and may be subject to change. Harding Loevner may currently hold or has previously held positions in the securities referenced, but there is no guarantee that Harding Loevner currently owns, or has ever owned, the securities mentioned herein. If Harding Loevner owns any of these securities, it may sell them at any time.
Any discussion of specific securities is not a recommendation to purchase or sell a particular security. Non-performance based criteria have been used to select the securities identified. It should not be assumed that investment in the securities identified has been or will be profitable. To request a complete list of holdings for the past year, please contact Harding Loevner.
There is no guarantee that any investment strategy will meet its objective. Past performance does not guarantee future results.
© 2025 Harding Loevner