Active Management

Surplus Surprise: Vietnam, Emerging Markets Top Global Trade with US

Frontier emerging markets (FEMs) fell in the fourth quarter after the election of Donald Trump in the US ushered in expectations that tariff hikes on a broad range of imports to the US will lead to inflationary pressure.

Portrait of Sergey Dubin, Analyst and Portfolio Manager at Harding Loevner.
Sergey Dubin, CFA contributed research and viewpoints to this piece.

Frontier emerging markets (FEMs) fell in the fourth quarter after the election of Donald Trump in the US ushered in expectations that tariff hikes on a broad range of imports to the US will lead to inflationary pressure. Vietnam was one of the worst-performing FEMs, for good reason: the US is its largest export market. Its exports to the US account for more than 25% of its GDP, by far the largest percentage among FEMs. Exports to the US don’t account for more than 5% of the GDP in any other FEM country (though the US is the largest export market for the Philippines, which also weighed down FEMs in the fourth quarter).

In fact, Vietnam is the only FEM that has become one of the ten largest trading partners with the US. While there are other EM countries, such as Mexico, Taiwan, and India among the top-ten US trading partners, Vietnam has grown a significant trade surplus with the US, due in part to companies rerouting shipments through the country as supply chains have adjusted over the past several years, especially in the wake of disruptions during the COVID-19 pandemic.
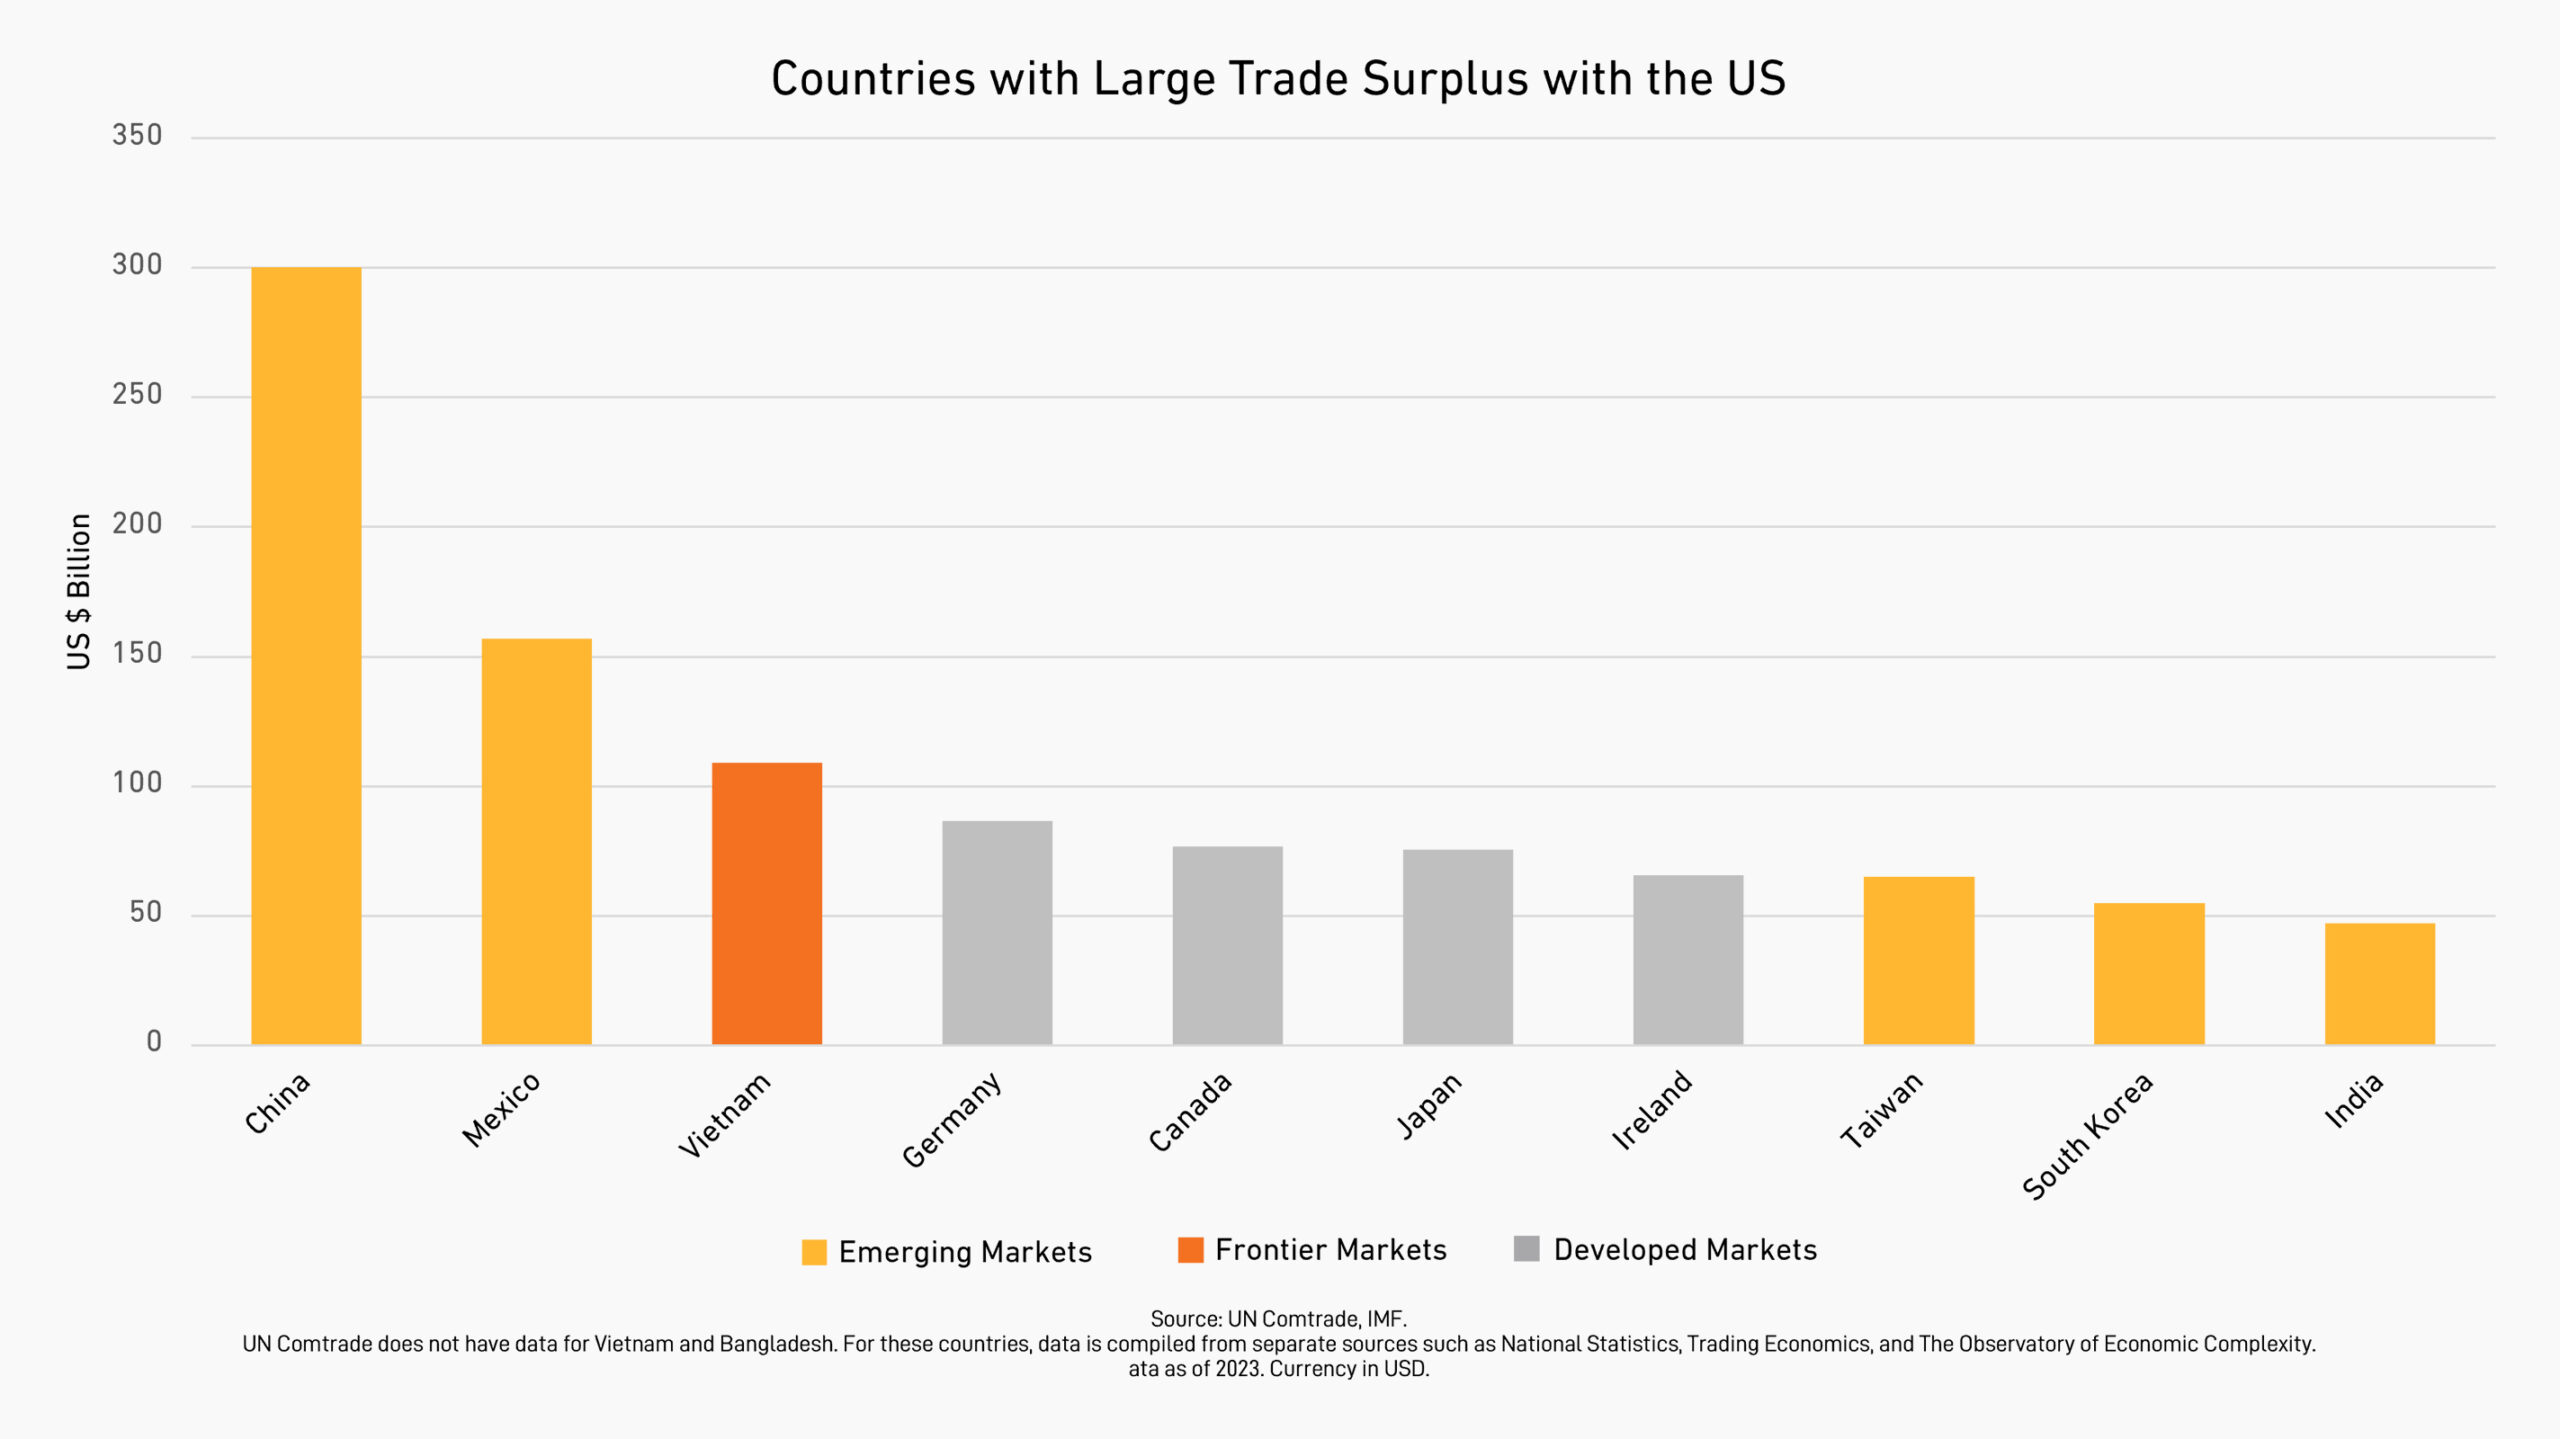
Column chart showing countries with large trade surpluses with the US as of 2023: Frontier Emerging Markets (Vietnam: US$109 billion), Emerging Markets (China: US$300 billion, Mexico: US$157 billion, Taiwan: US$65 billion, South Korea: US$55 billion, India: US$47 billion), and Developed Markets (Germany: US$86 billion, Canada: US$77 billion, Japan: US$75 billion, Ireland: US$66 billion).

The chart above also shows China’s outsized trade surplus with the US and underscores how global trade has not stopped due to shifts in US policy since the first Trump election in 2016. What has happened is that global trade has evolved over the last eight years, especially with respect to emerging markets, despite tariffs under both the Trump and Biden administrations.
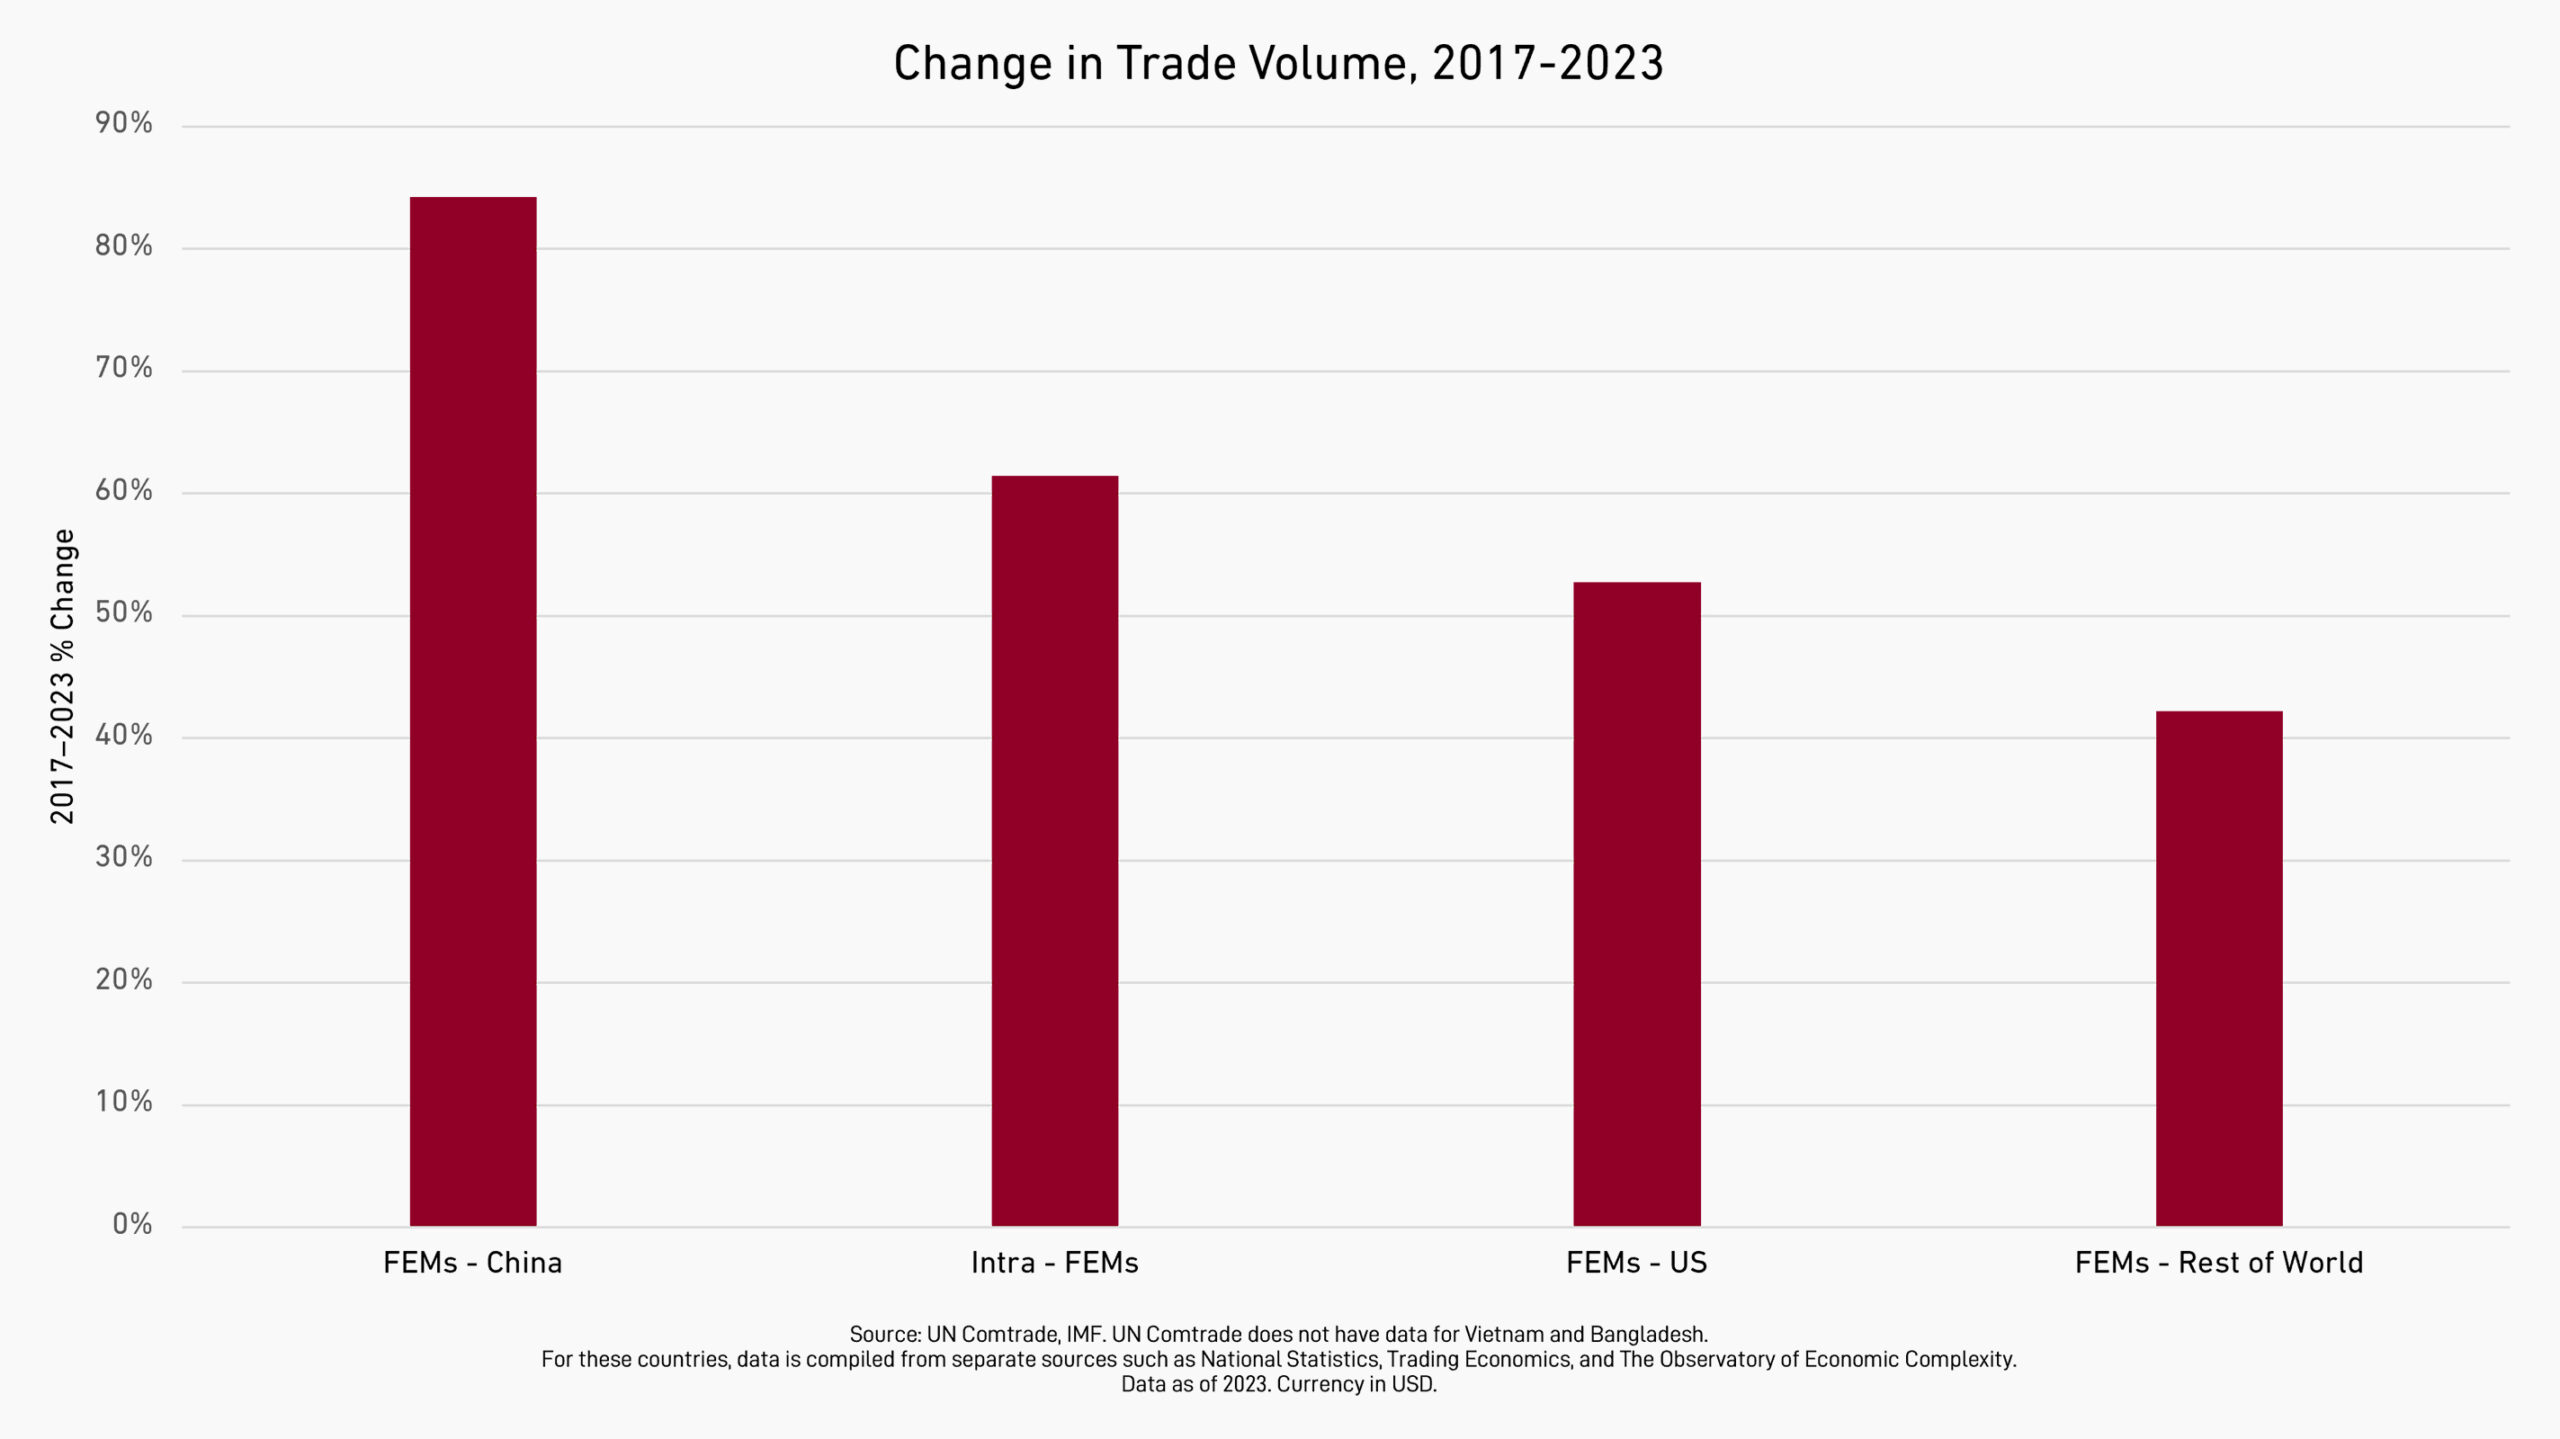
Column chart depicting the percentage change in trade volume among frontier emerging markets between 2017 and 2023: FEMs-China (84%), Intra-FEMs (61%), FEMS-US (53%), FEMs-rest of the world (42%).

China, one of the primary targets of US tariffs, has simply rerouted its exports. Some of the biggest growth in global trade volumes has come from both the US’s and China’s increase in trade with EMs. Trade between EMs is growing as well. And the current account balances of important export-oriented EMs such as Mexico, Taiwan, South Africa, and Indonesia are significantly better than they were eight years ago, providing these economies with a larger cushion against volatility in global trade. ∎

More Insights

TSMC Leads Emerging-Markets Returns due to AI Enthusiasm

Momentum strategies were a powerful force for global equities in 2024, primarily ones that followed artificial intelligence (AI) and its...

Currency Depreciation: A Rational Response to Tariffs?

The US dollar’s rise since September cut into international markets. Of the 7% decline in international markets in the fourth...

Salesforce, ServiceNow Benefit from Next Phase of the AI Wave

By now, it is clear to most investors that the companies benefiting from the move to artificial intelligence (AI) number...

Receive our investment updates in your inbox
Quarterly Commentaries
Monthly Reports
Quarterly Webcast Schedule
Insights from our Investment Team
Company HLHP
Opt-In Confirmation*
 

*By checking “Opt-In Confirmation,” you consent to receive investment updates from Harding Loevner. You can withdraw your consent at any time. Contact us.

The “Fundamental Thinking” series presents the perspectives of Harding Loevner’s analysts on a range of investment topics, highlighting our fundamental research and providing insight into how we approach quality growth investing. For more detailed information regarding particular investment strategies, please visit our website, www.hardingloevner.com. Any statements made by employees of Harding Loevner are solely their own and do not necessarily express or relate to the views or opinions of Harding Loevner.

The information provided is as of the publication date and may be subject to change. Harding Loevner may currently hold or has previously held positions in the securities referenced, but there is no guarantee that Harding Loevner currently owns, or has ever owned, the securities mentioned herein. If Harding Loevner owns any of these securities, it may sell them at any time.

Any discussion of specific securities is not a recommendation to purchase or sell a particular security. Non-performance based criteria have been used to select the securities identified. It should not be assumed that investment in the securities identified has been or will be profitable. To request a complete list of holdings for the past year, please contact Harding Loevner.

There is no guarantee that any investment strategy will meet its objective. Past performance does not guarantee future results.

© 2025 Harding Loevner